Covid-19 England Awards
Things are looking pretty grim in terms of Covid-19 in England. But there are some areas that are doing well. This page seeks to highlight local authorities that are navigating better than others through the Covid-19 second wave. Perhaps there are things we can learn from them.
See the source code is available on Github if you want to look at this and other analyses, including analyses of the Covid-19 case data in England in areas that aren’t doing so well. The data on this page is from https://coronavirus.data.gov.uk/downloads/csv/coronavirus-cases_latest.csv and reports “lab-confirmed positive COVID-19 PCR test on or up to the specimen date”. The specimen date is the date that someone had the test taken. The government site has more details about the meaning of case numbers.
These awards are based on data updated on November 28 but the awards will be based on data since November 23 because it can take a number of days to process the test and to report the result.
The figures we’re going to give awards for are based on a rolling seven day average of figures from the previous week.
When we compare local authorities, we need to bear in mind that different local authorities have different sizes. A small absolute number of cases in a large local authority is a greater achievement than that number of cases in a smaller local authority, because it means a smaller percentage of the population are affected.
So we need to calculate infection rates. To do that, we’re using population data from the ONS and calculating rates per 100,000 people.
National awards
The following are the awards across the whole of England.
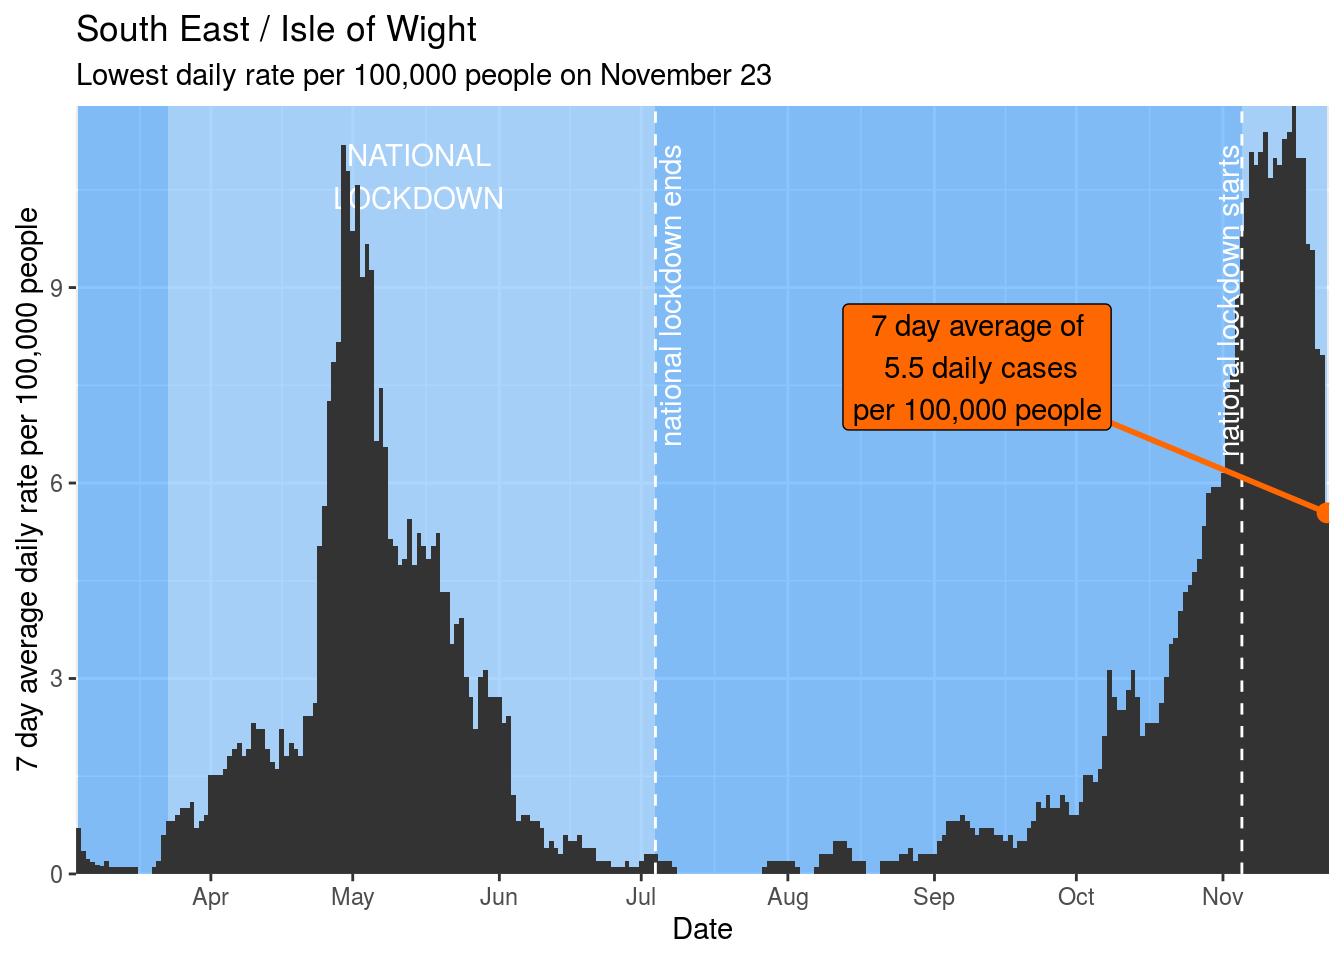
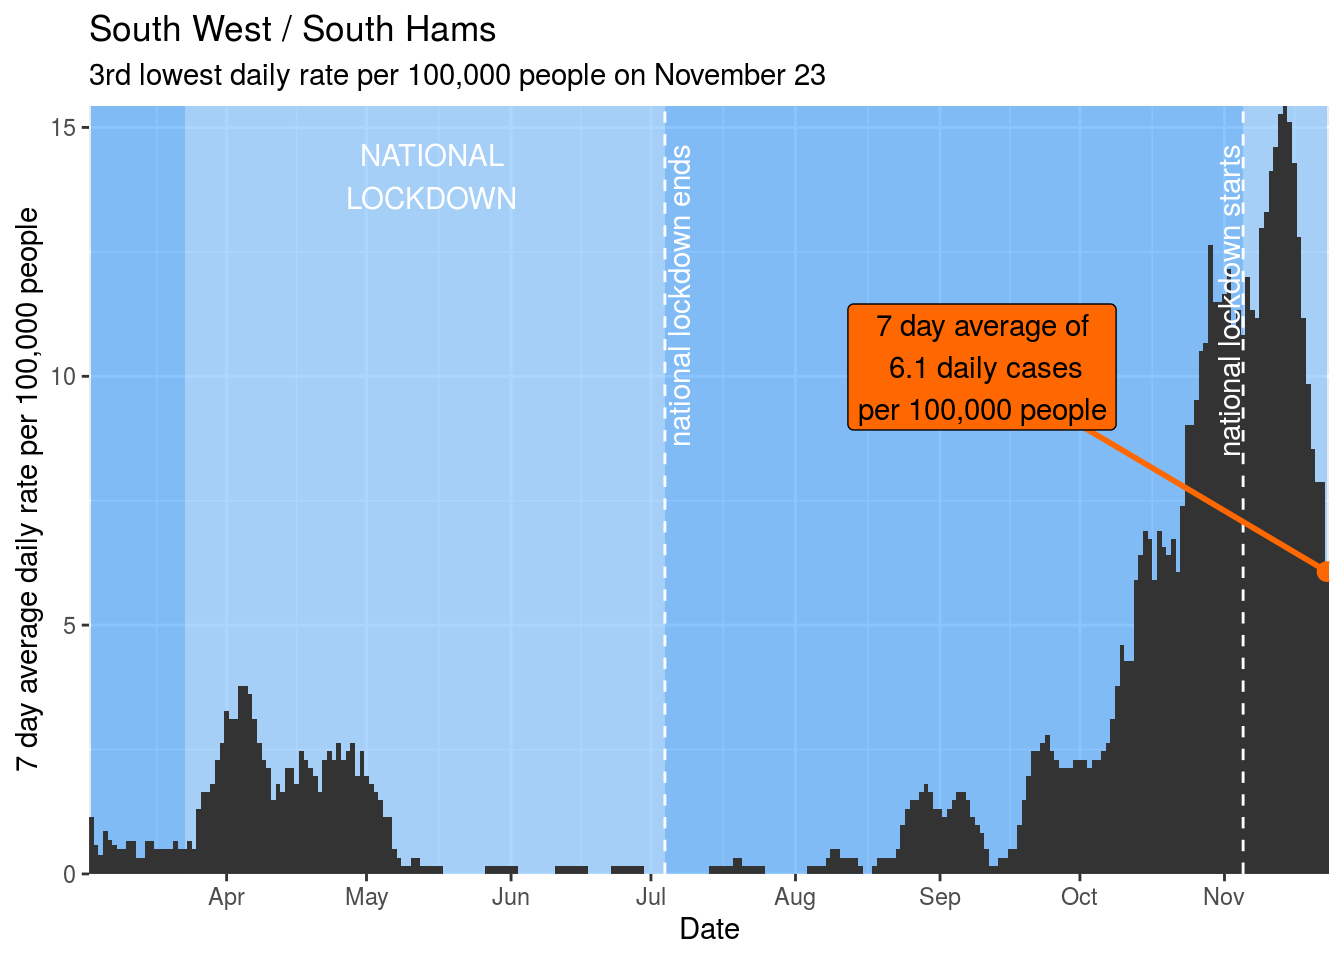
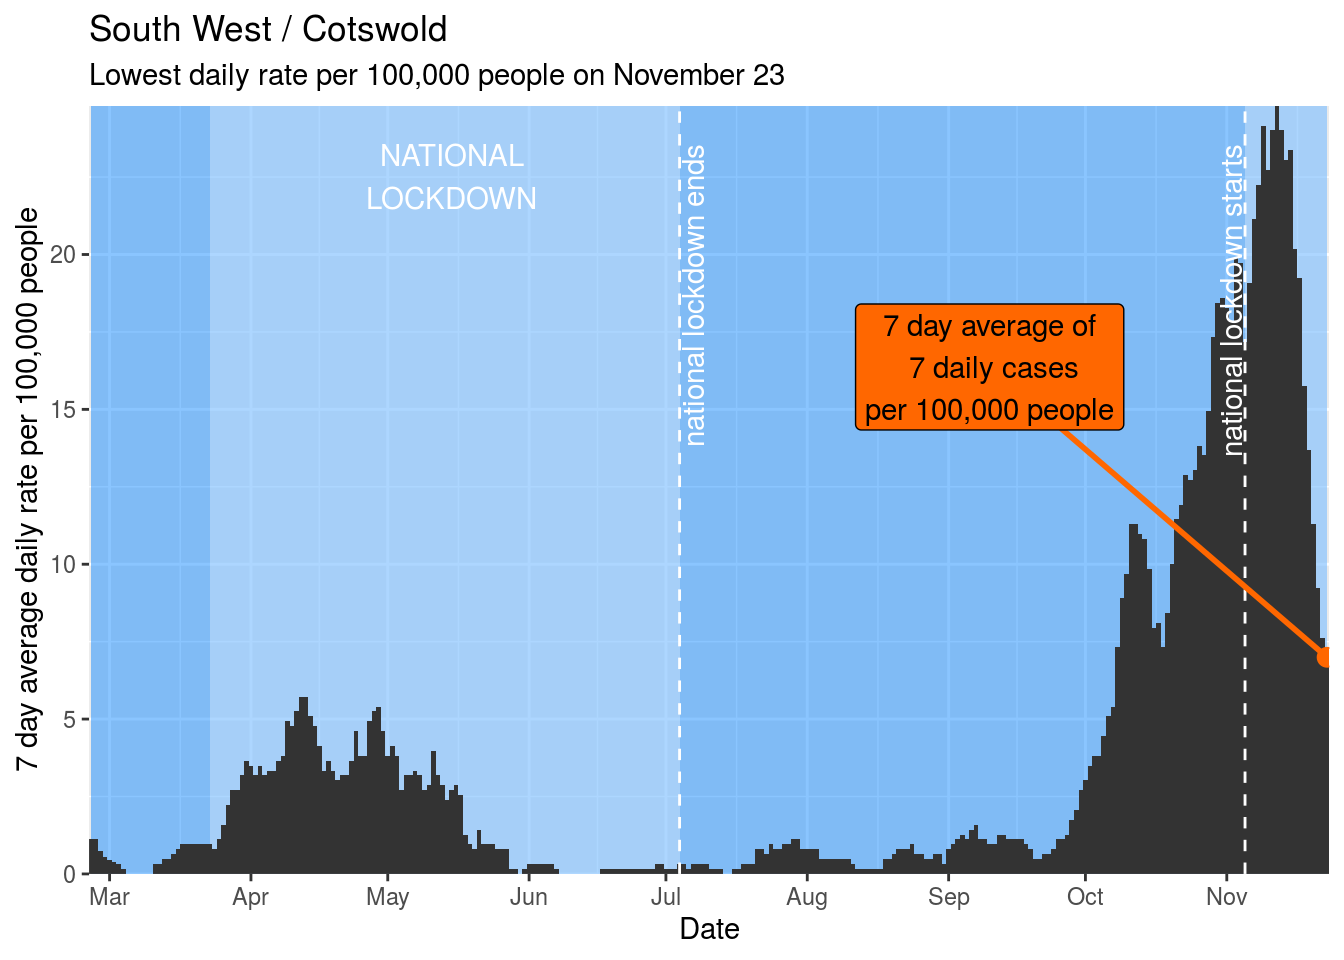
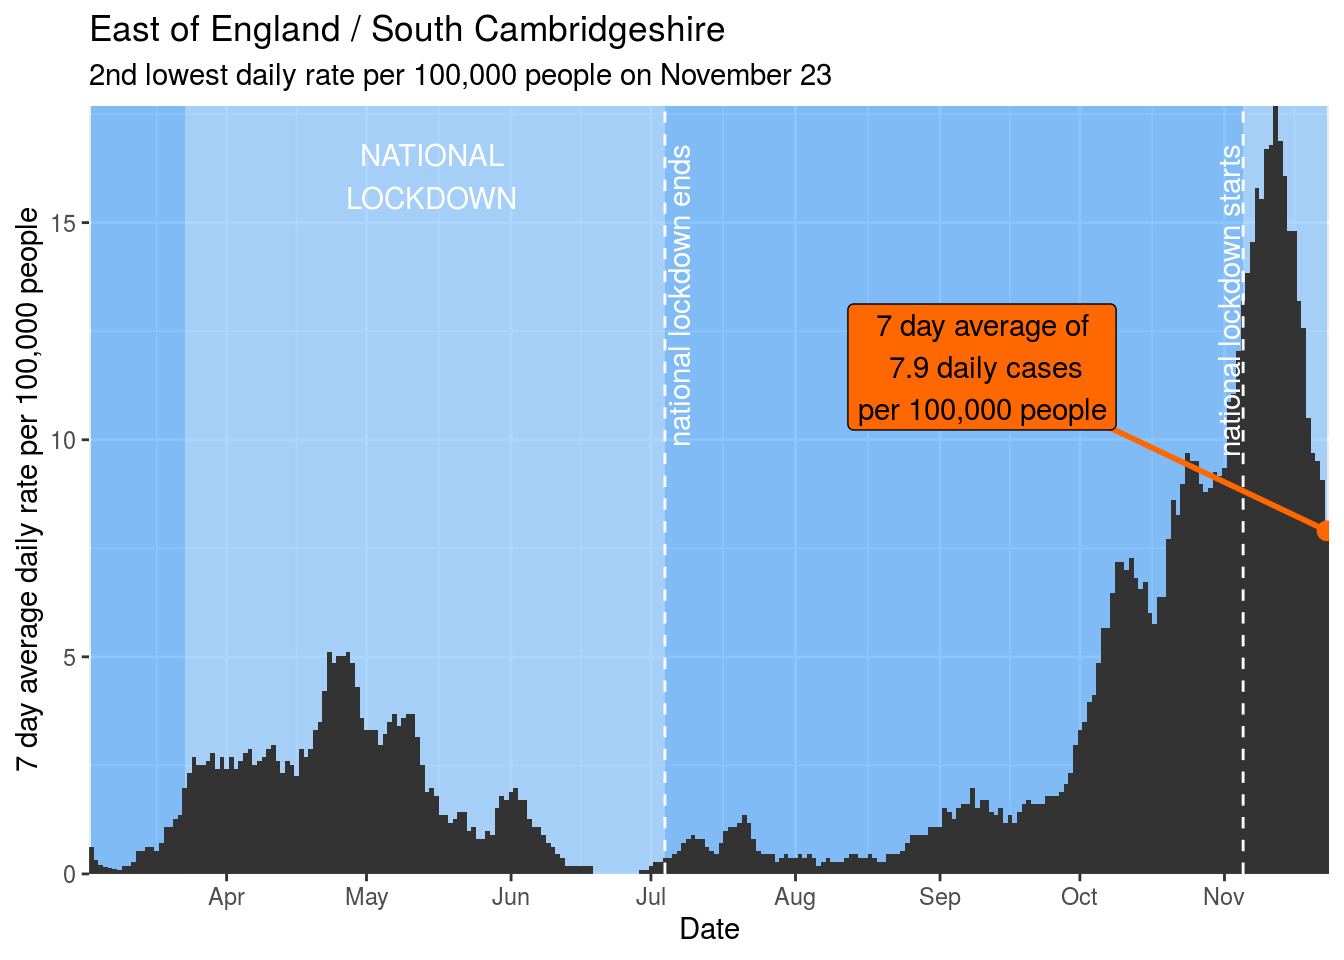
Lowest daily rate
This set of awards is going to the areas that had the lowest average daily rates of cases per 100,000 population on November 23. These are:
1st : Isle of Wight
2nd : Worthing

3rd : South Hams
Top 10
- Isle of Wight
- Worthing
- South Hams
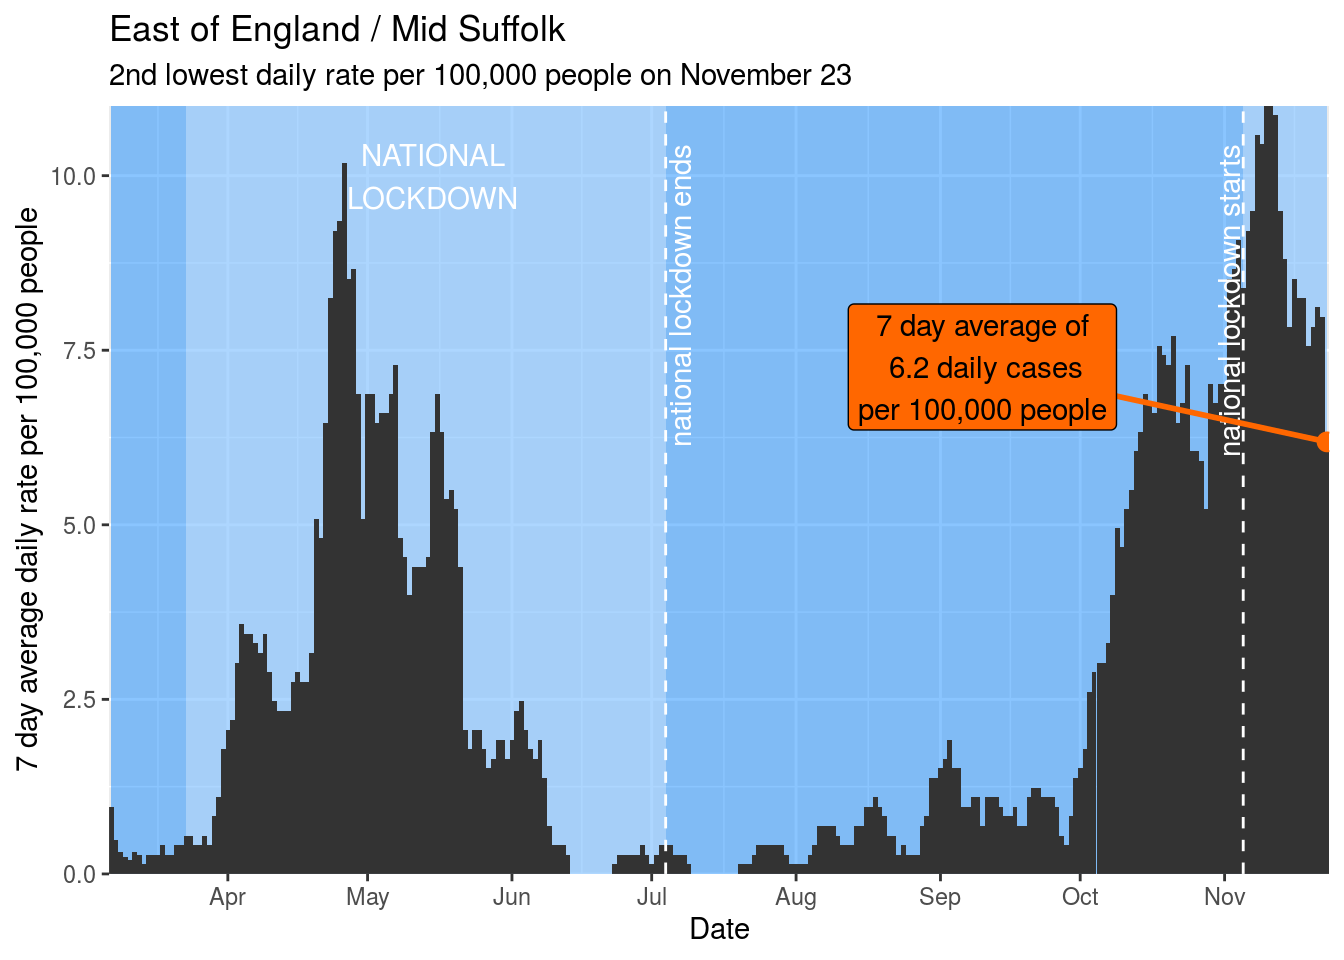
- Mid Suffolk
- Cotswold
- Cornwall and Isles of Scilly
- Adur
- West Suffolk
- South Cambridgeshire
- Dorset
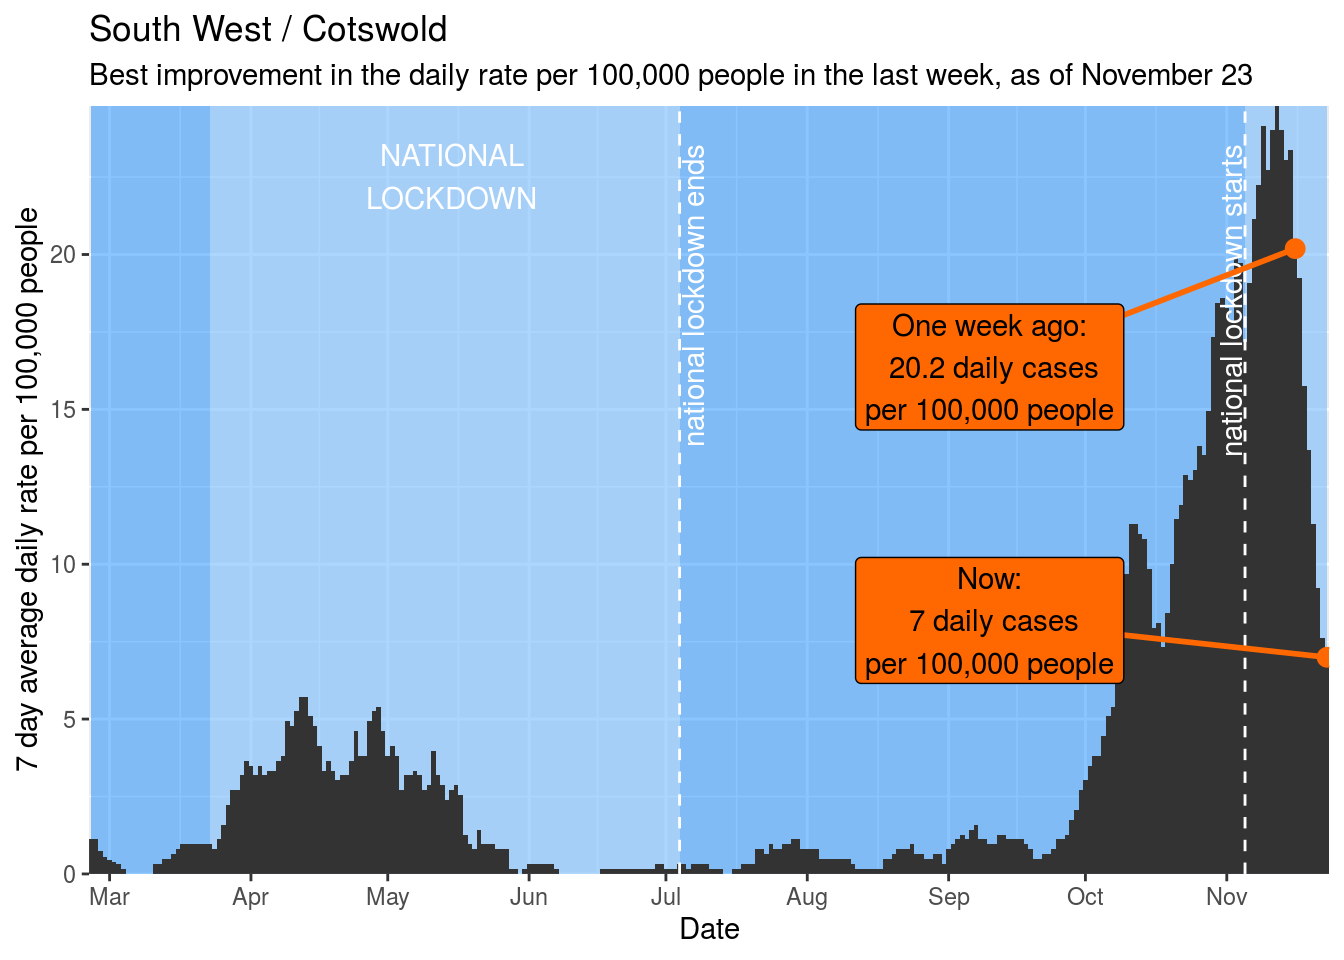
Most improved in last week
Arguably a better way of awarding local authority areas is by how much they are improving. This set of awards go to those places that have improved the most over in the week up to November 23. These are:
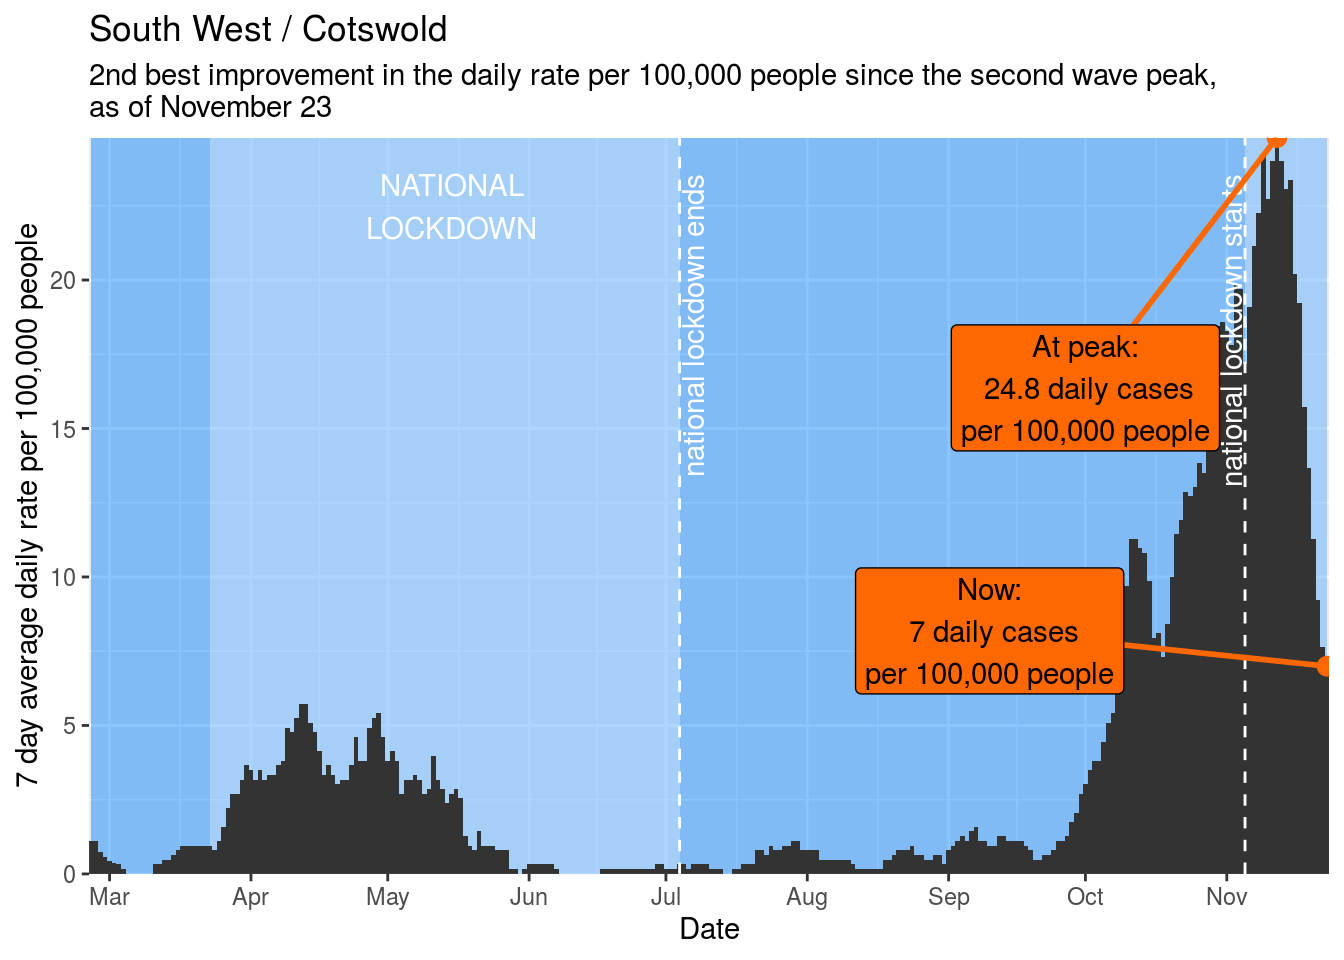
1st : Cotswold
2nd : South Hams

3rd : New Forest

Top 10
- Cotswold
- South Hams
- New Forest
- Worthing
- Arun
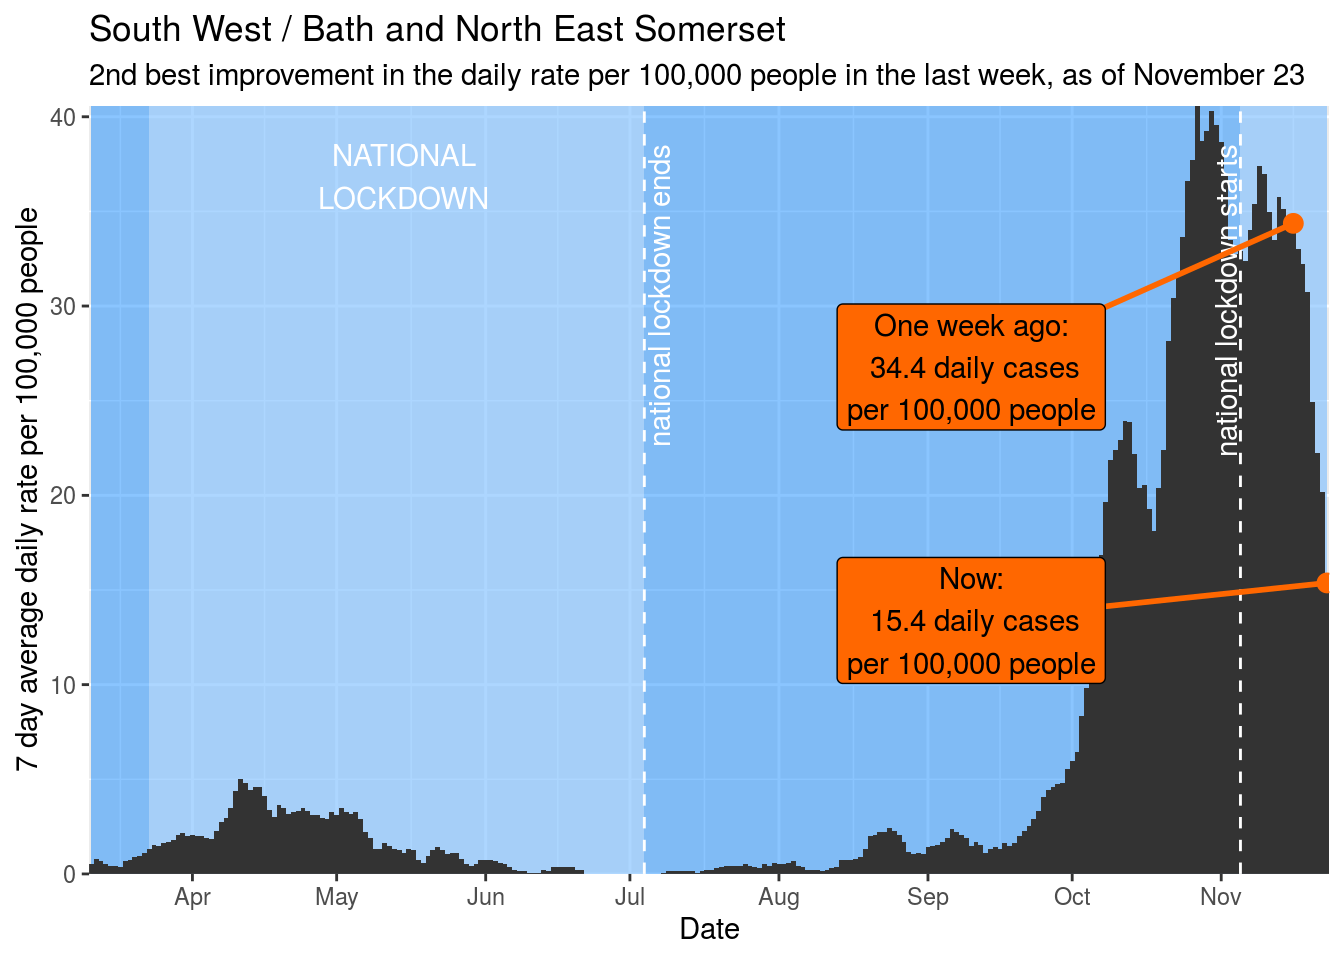
- Bath and North East Somerset
- Southampton
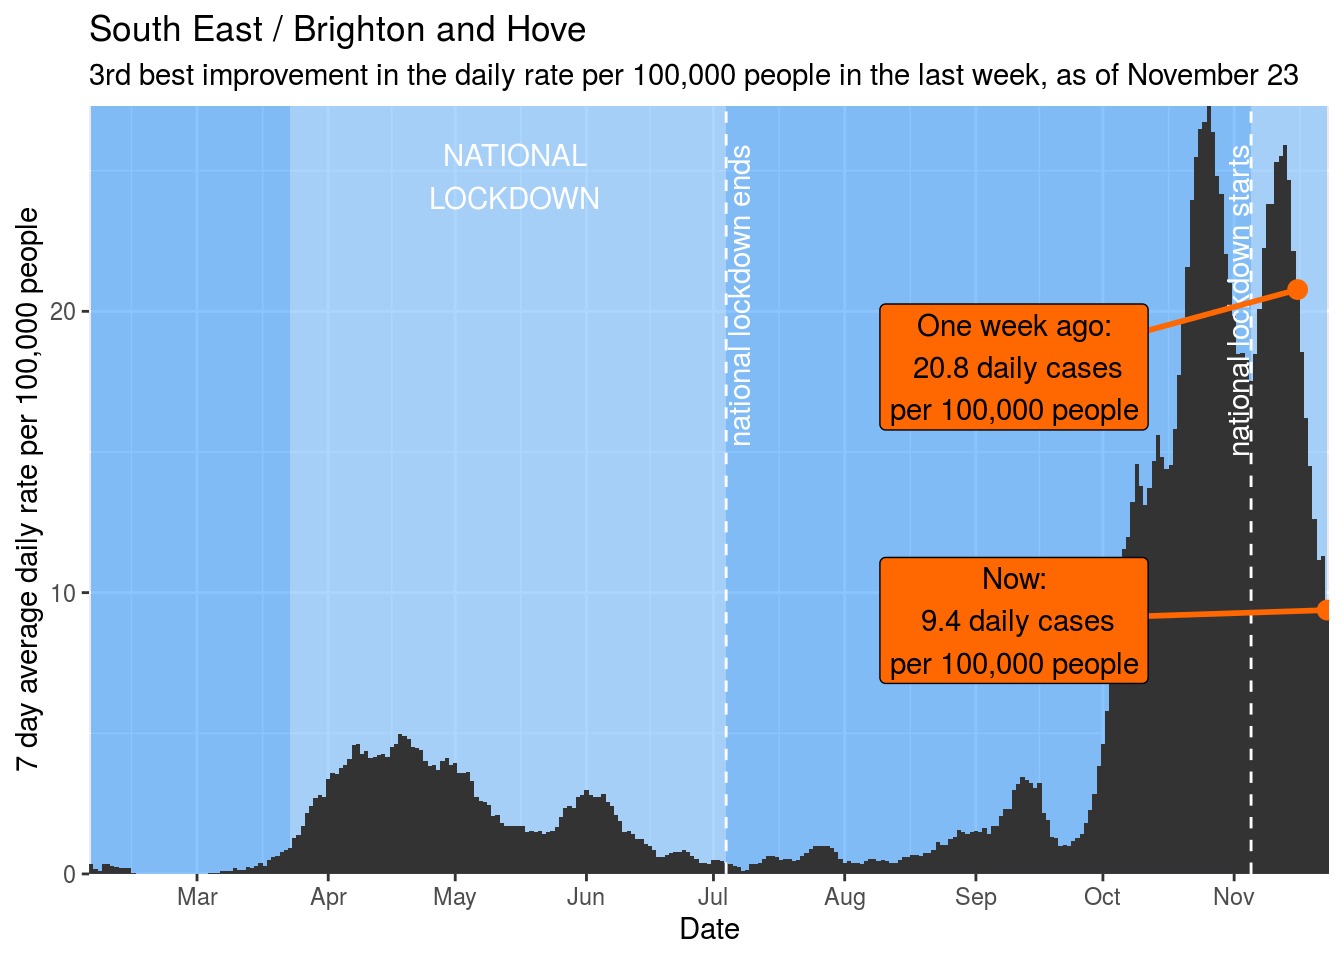
- Brighton and Hove
- Adur
- Torbay
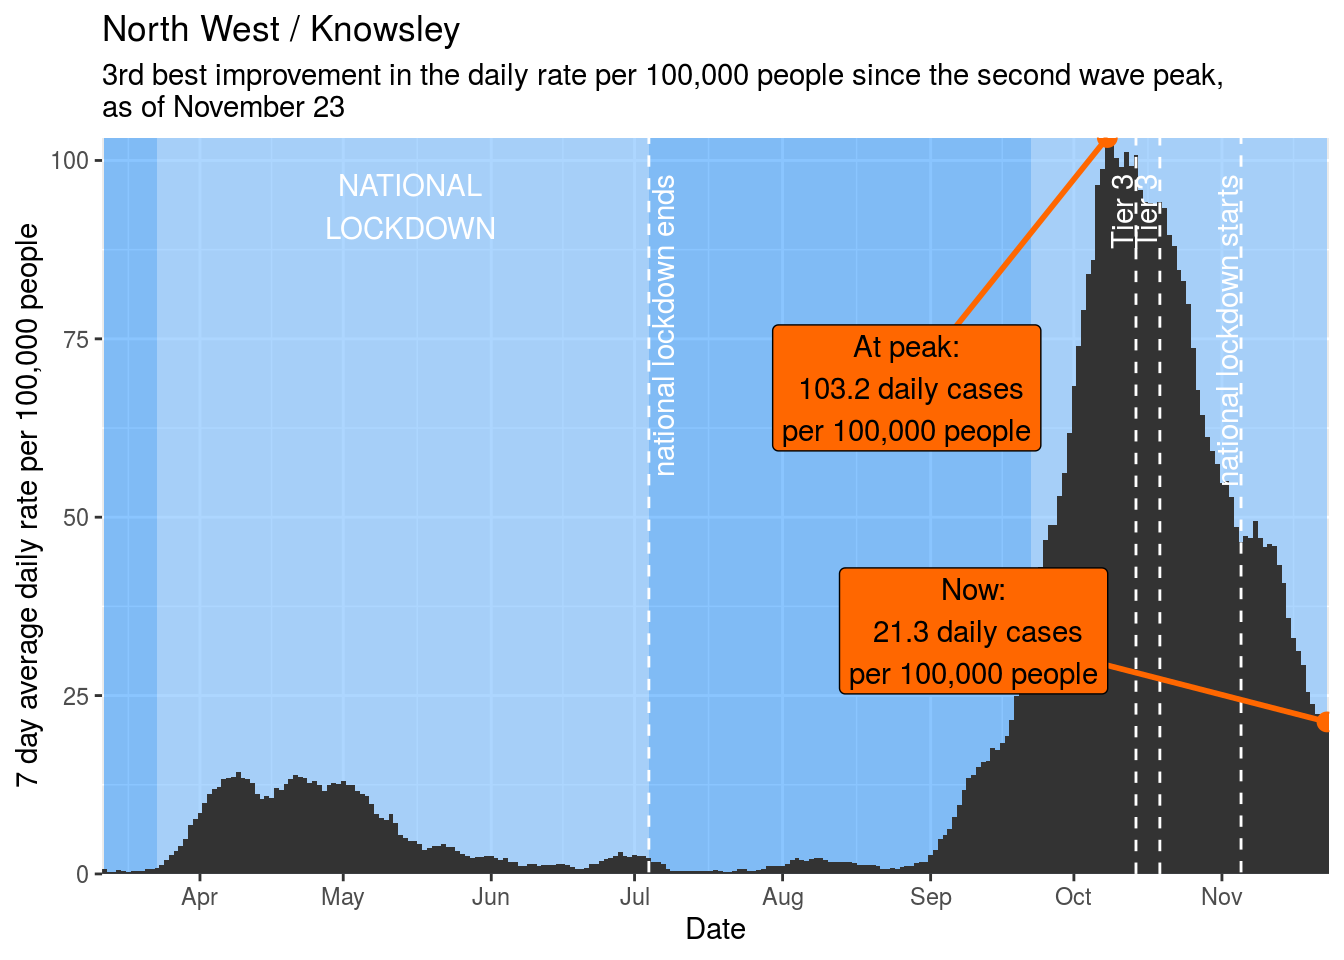
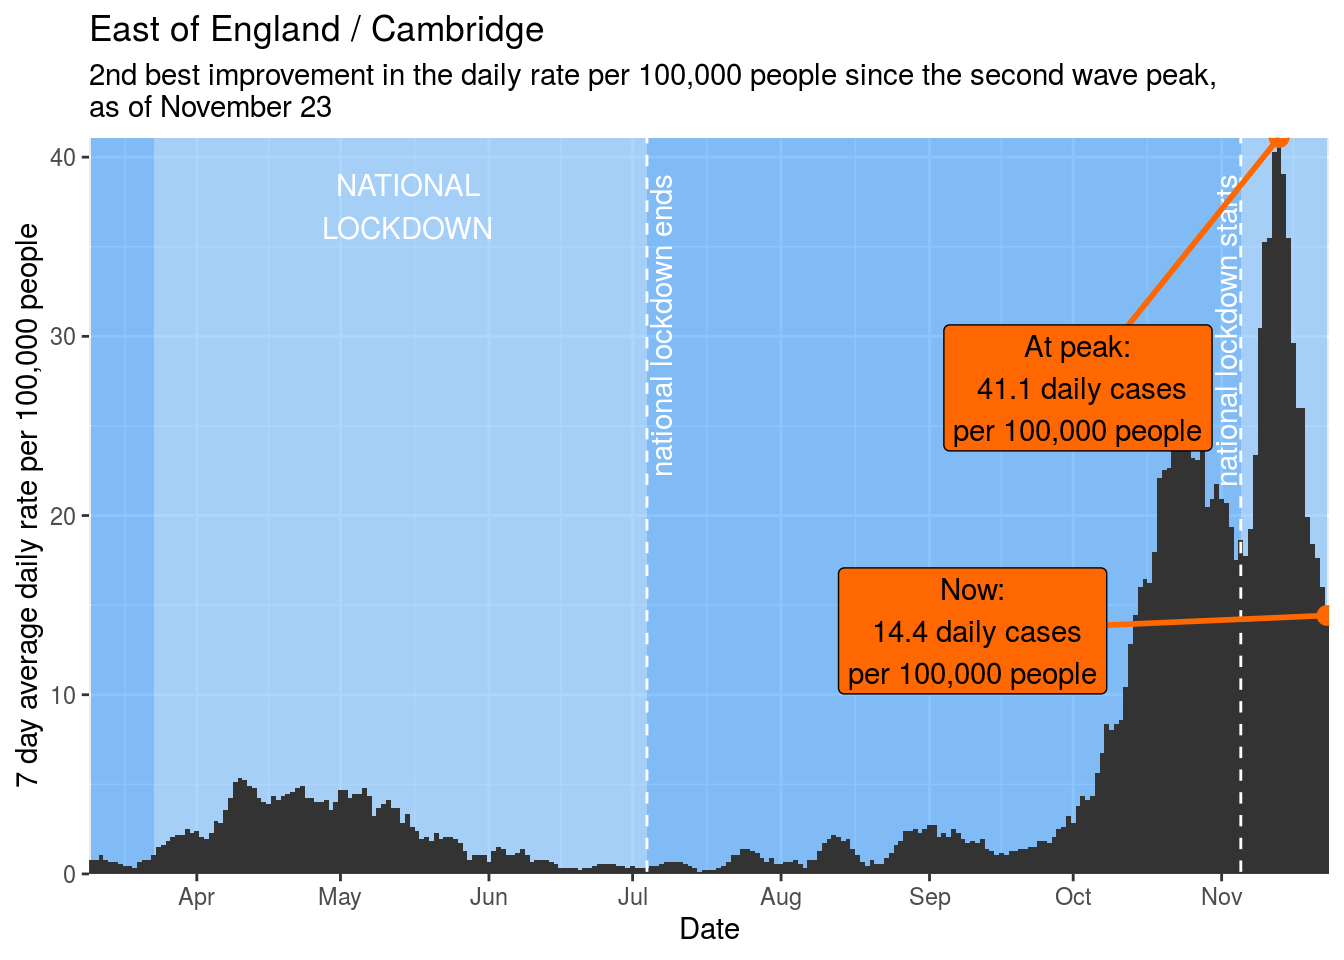
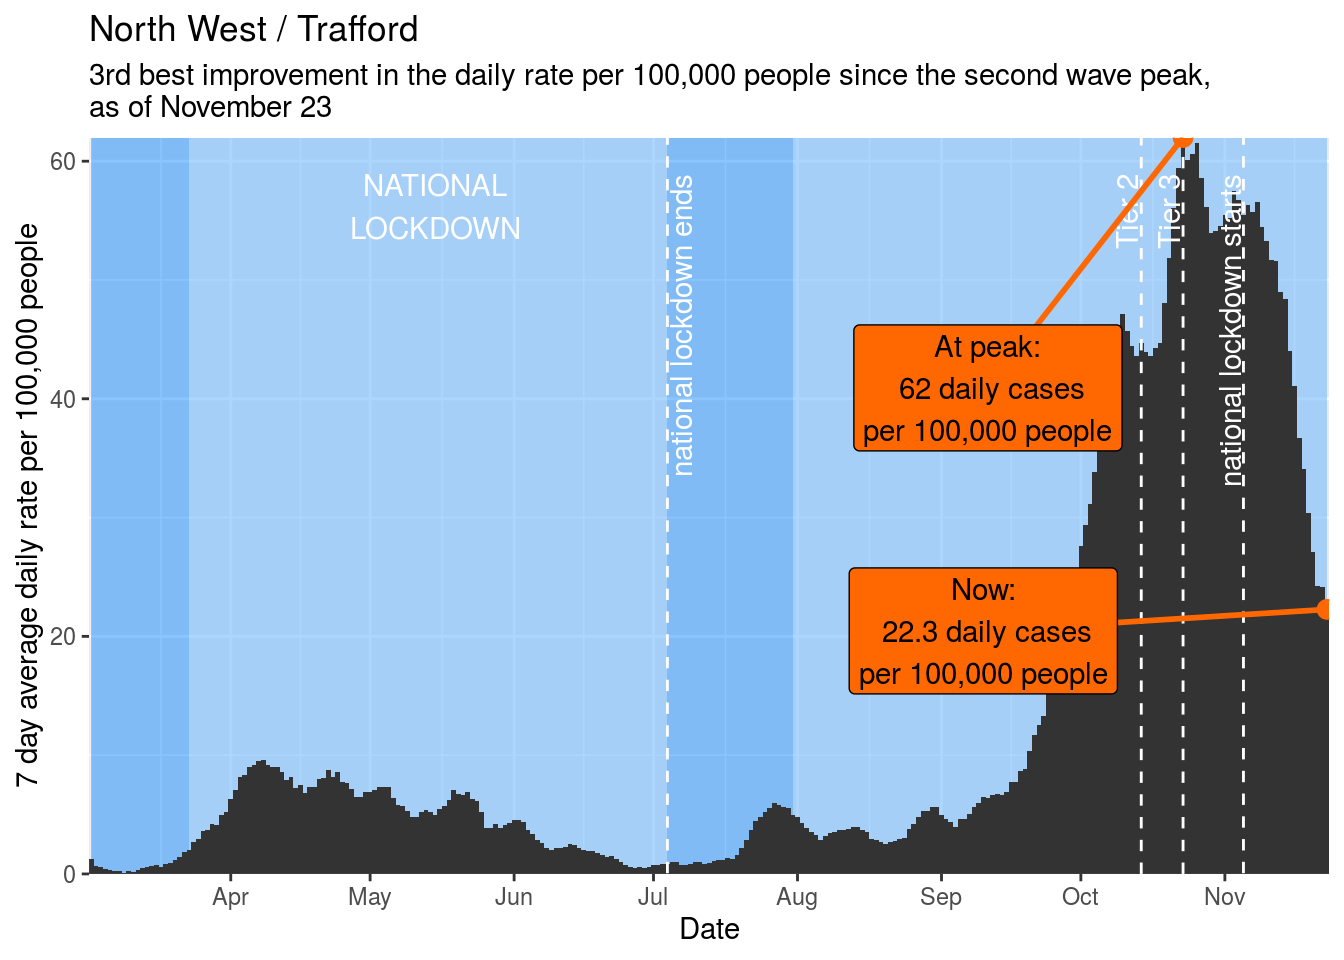
Most improved since 2nd wave peak
Our final set of awards go to those places that have improved the most since their 2nd wave peak. These are:
1st : Nottingham

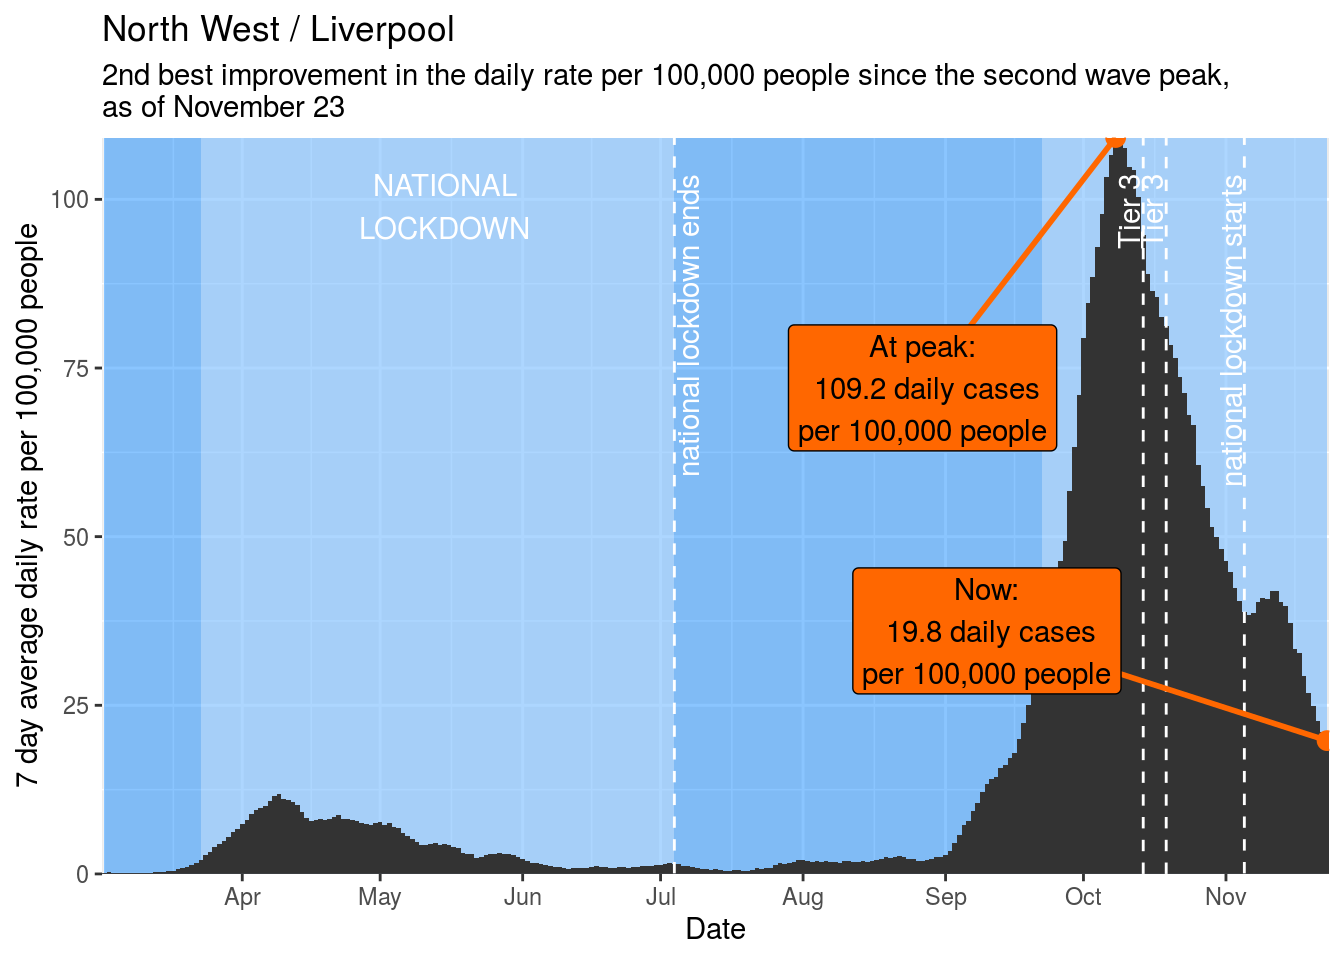
2nd : Liverpool

3rd : Knowsley
Top 10
- Nottingham
- Liverpool
- Knowsley
- Lancaster
- York
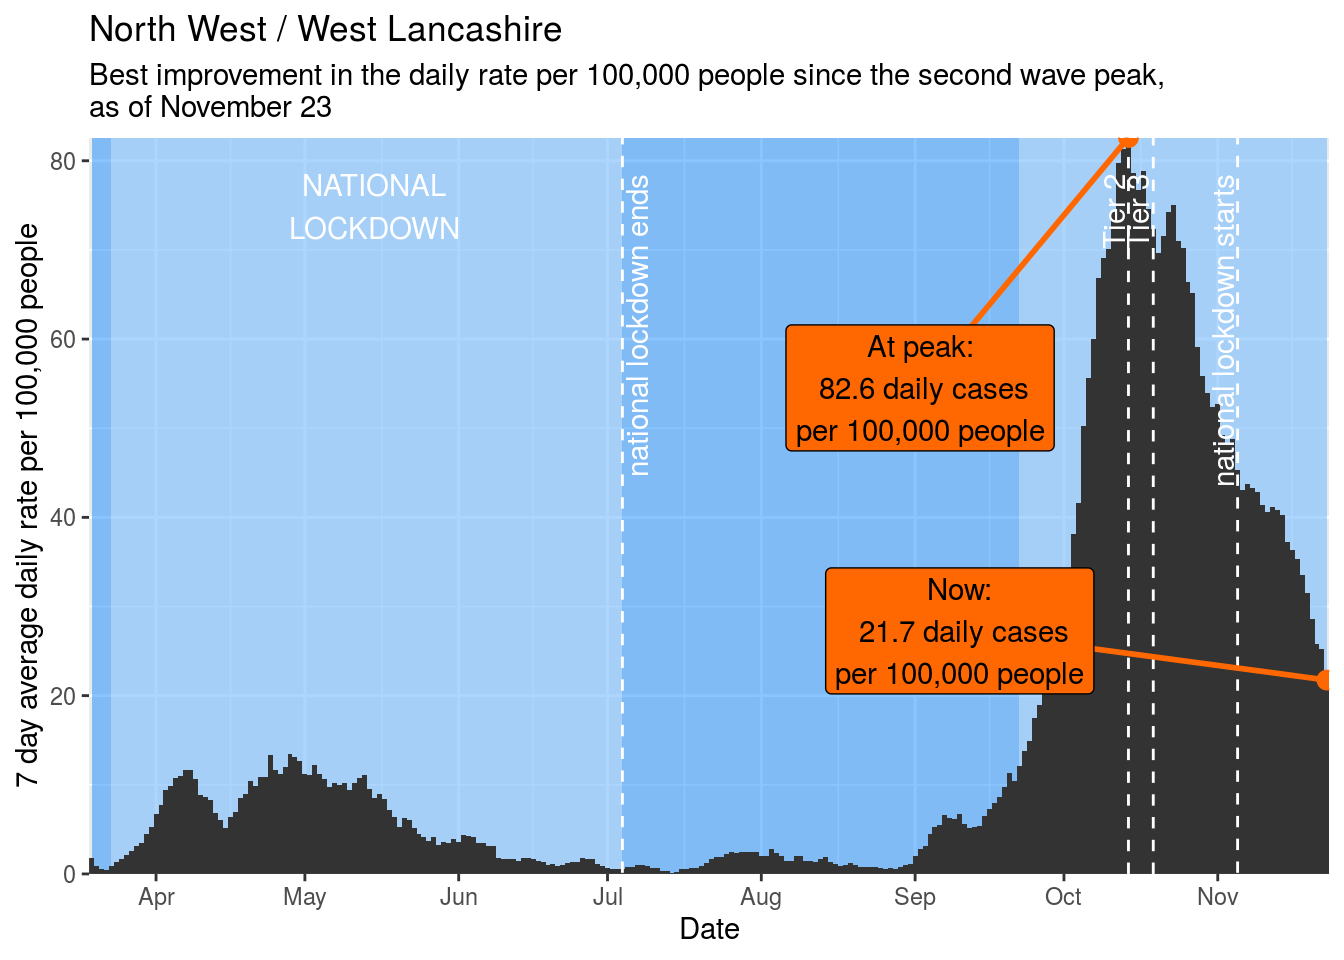
- West Lancashire
- Exeter
- Sefton
- Newcastle upon Tyne
- Manchester
Awards within different deprivation levels
I’m also splitting local authorities into five different categories based on the Indices of Deprivation from 2019, which provide a measure of how deprived areas are, and giving awards within these categories.
Highest quintile of deprivation
Barking and Dagenham | Barnsley | Barrow-in-Furness | Birmingham | Blackburn with Darwen | Blackpool | Bolton | Bradford | Burnley | County Durham | Doncaster | East Lindsey | Gateshead | Great Yarmouth | Hackney and City of London | Halton | Haringey | Hartlepool | Hastings | Hyndburn | Islington | Kingston upon Hull, City of | Knowsley | Leeds | Leicester | Lewisham | Lincoln | Liverpool | Manchester | Mansfield | Middlesbrough | Newcastle upon Tyne | Newham | North East Lincolnshire | Norwich | Nottingham | Oldham | Pendle | Peterborough | Portsmouth | Preston | Redcar and Cleveland | Rochdale | Rotherham | Salford | Sandwell | Sefton | Sheffield | South Tyneside | Southampton | St. Helens | Stoke-on-Trent | Sunderland | Swale | Tameside | Tendring | Thanet | Torbay | Tower Hamlets | Wakefield | Walsall | Wirral | Wolverhampton
Lowest daily rate
This set of awards is going to go to the areas that had the lowest average daily rates of cases per 100,000 population on November 23. These are:
1st : Tendring
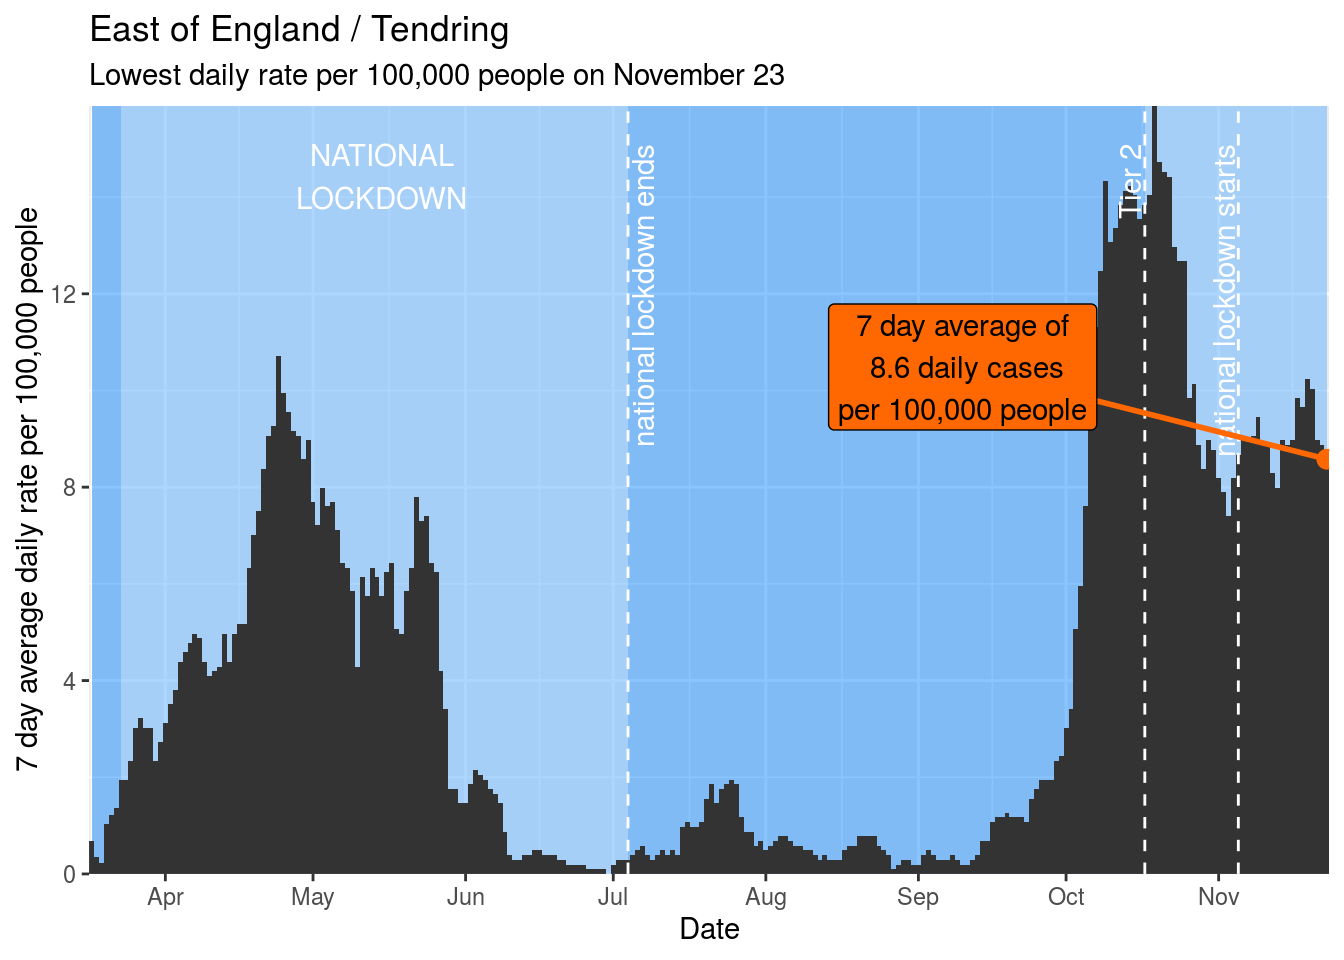
2nd : Great Yarmouth
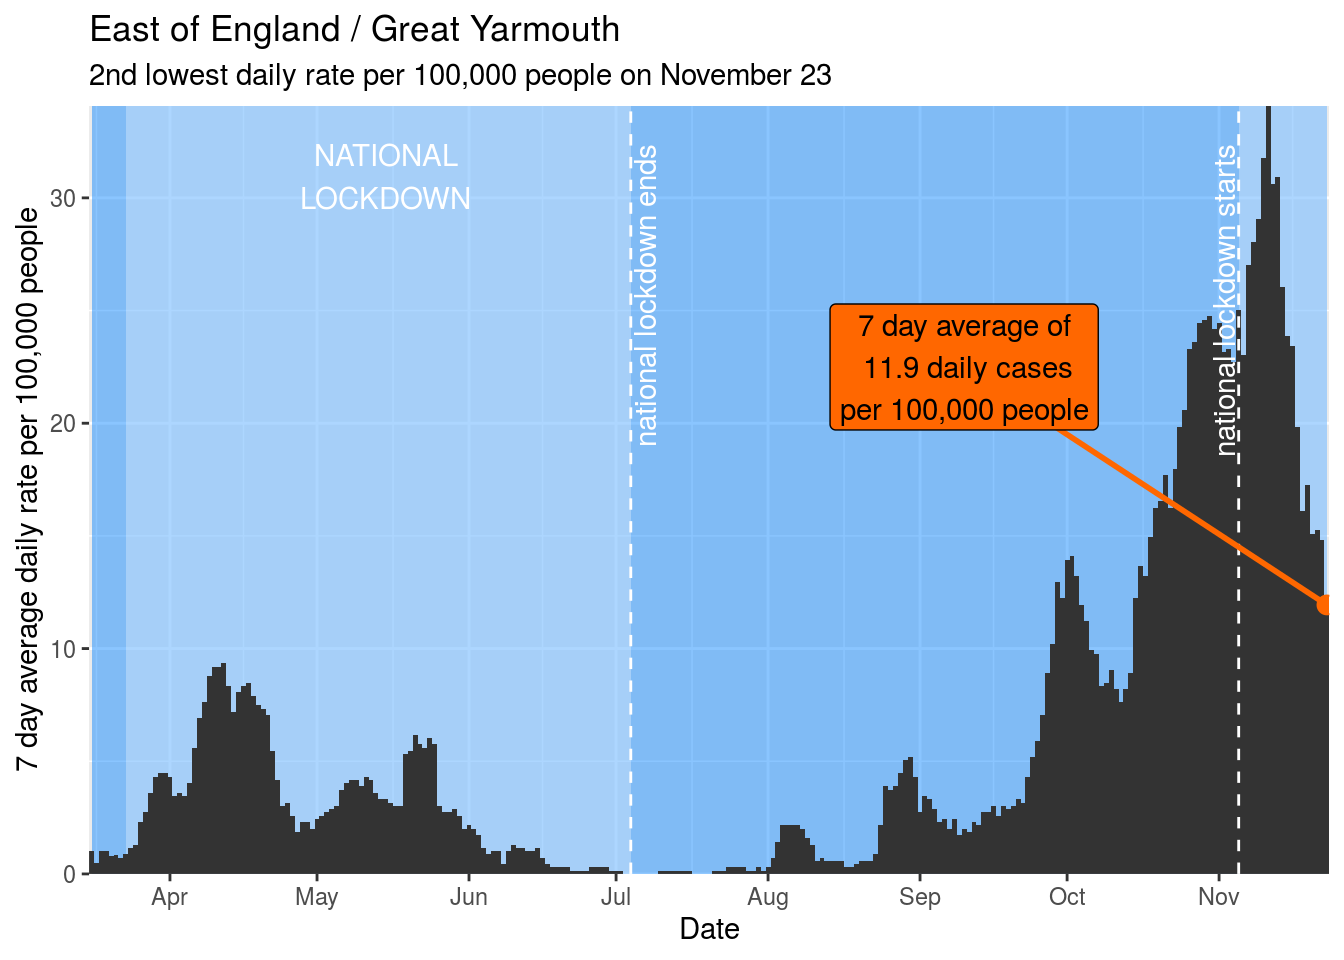
3rd : Barrow-in-Furness
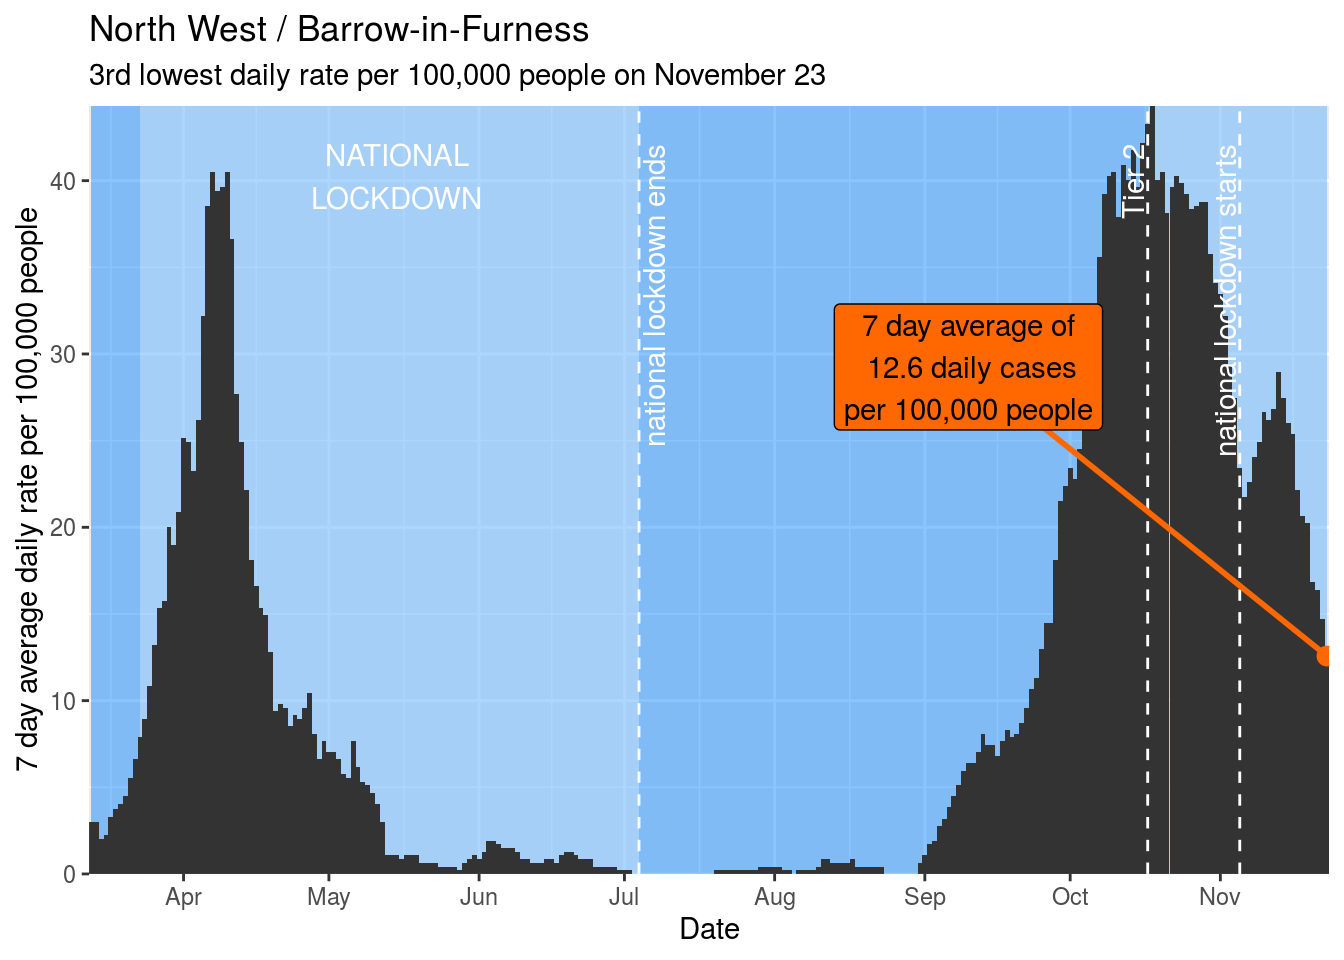
Top 10
- Tendring
- Great Yarmouth
- Barrow-in-Furness
- Torbay
- Hastings
- Lewisham
- Southampton
- Wirral
- Islington
- Haringey
Most improved in last week
Arguably a better way of awarding local authority areas is by how much they are improving. This set of awards go to those places that have improved the most over in the week up to November 23. These are:
1st : Southampton

2nd : Torbay

3rd : Barrow-in-Furness
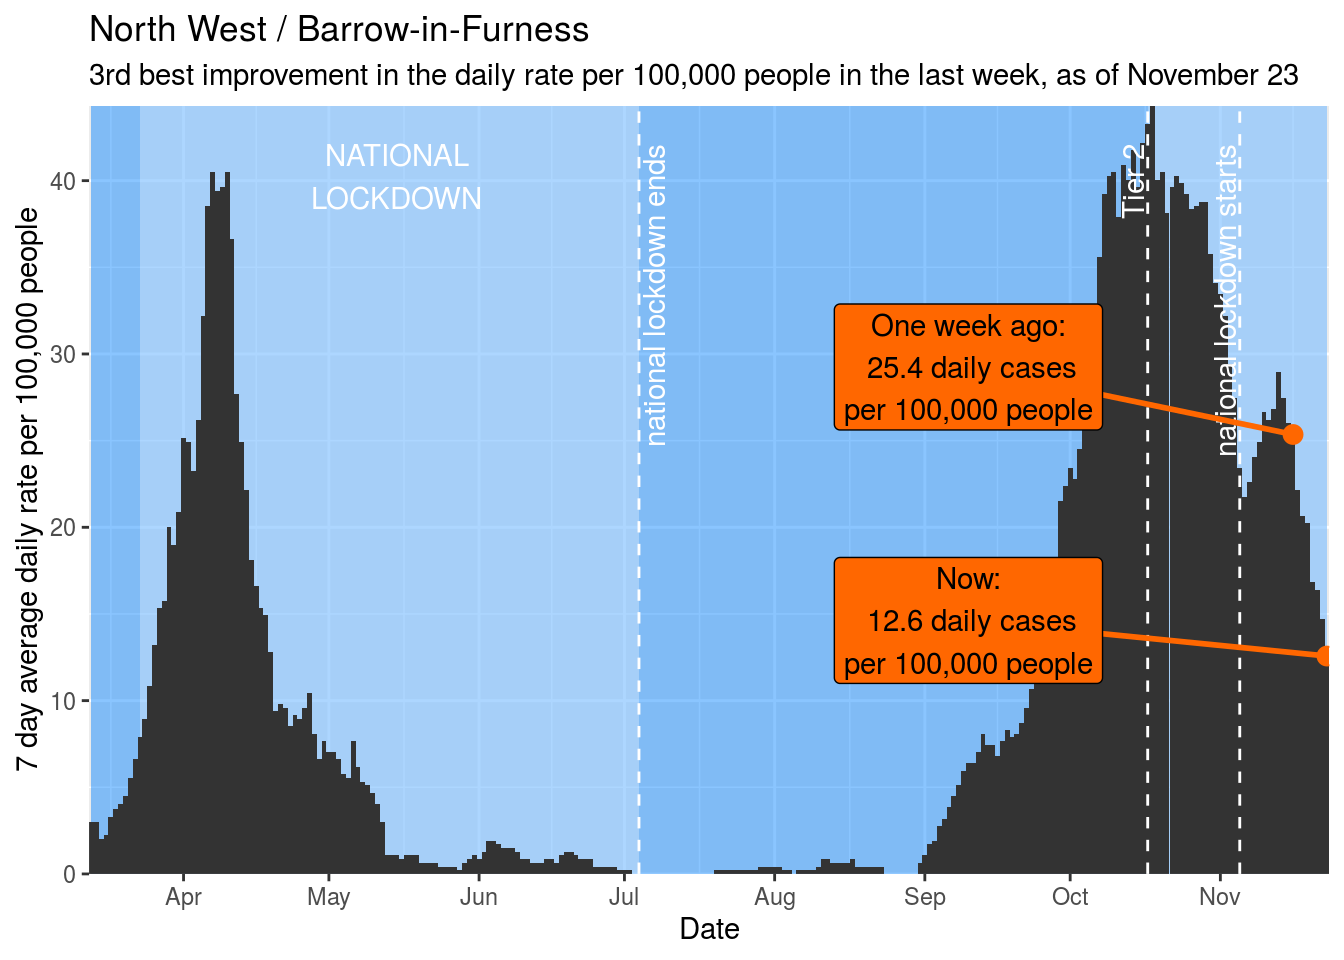
Top 10
- Southampton
- Torbay
- Barrow-in-Furness
- Great Yarmouth
- Salford
- Redcar and Cleveland
- Sefton
- Tameside
- Portsmouth
- Hartlepool
Most improved since 2nd wave peak
Our final set of awards go to those places that have improved the most since their 2nd wave peak. These are:
1st : Nottingham

2nd : Liverpool
3rd : Knowsley

Top 10
- Nottingham
- Liverpool
- Knowsley
- Sefton
- Newcastle upon Tyne
- Manchester
- Barrow-in-Furness
- Salford
- Wirral
- St. Helens
Second highest quintile of deprivation
Allerdale | Ashfield | Basildon | Bassetlaw | Bolsover | Boston | Brent | Bristol, City of | Bury | Calderdale | Carlisle | Chesterfield | Copeland | Corby | Cornwall and Isles of Scilly | Coventry | Croydon | Darlington | Derby | Dover | Dudley | Ealing | Eastbourne | Enfield | Fenland | Folkestone and Hythe | Gloucester | Gravesham | Greenwich | Hammersmith and Fulham | Harlow | Havant | Hounslow | Ipswich | Isle of Wight | Kensington and Chelsea | King’s Lynn and West Norfolk | Kirklees | Lambeth | Lancaster | Luton | Medway | North Lincolnshire | North Norfolk | North Tyneside | Northampton | Northumberland | Nuneaton and Bedworth | Plymouth | Redditch | Rossendale | Scarborough | Sedgemoor | Slough | Southend-on-Sea | Southwark | Stockton-on-Tees | Tamworth | Telford and Wrekin | Torridge | Waltham Forest | Wellingborough | Wigan | Wyre Forest
Lowest daily rate
This set of awards is going to go to the areas that had the lowest average daily rates of cases per 100,000 population on November 23. These are:
1st : Isle of Wight

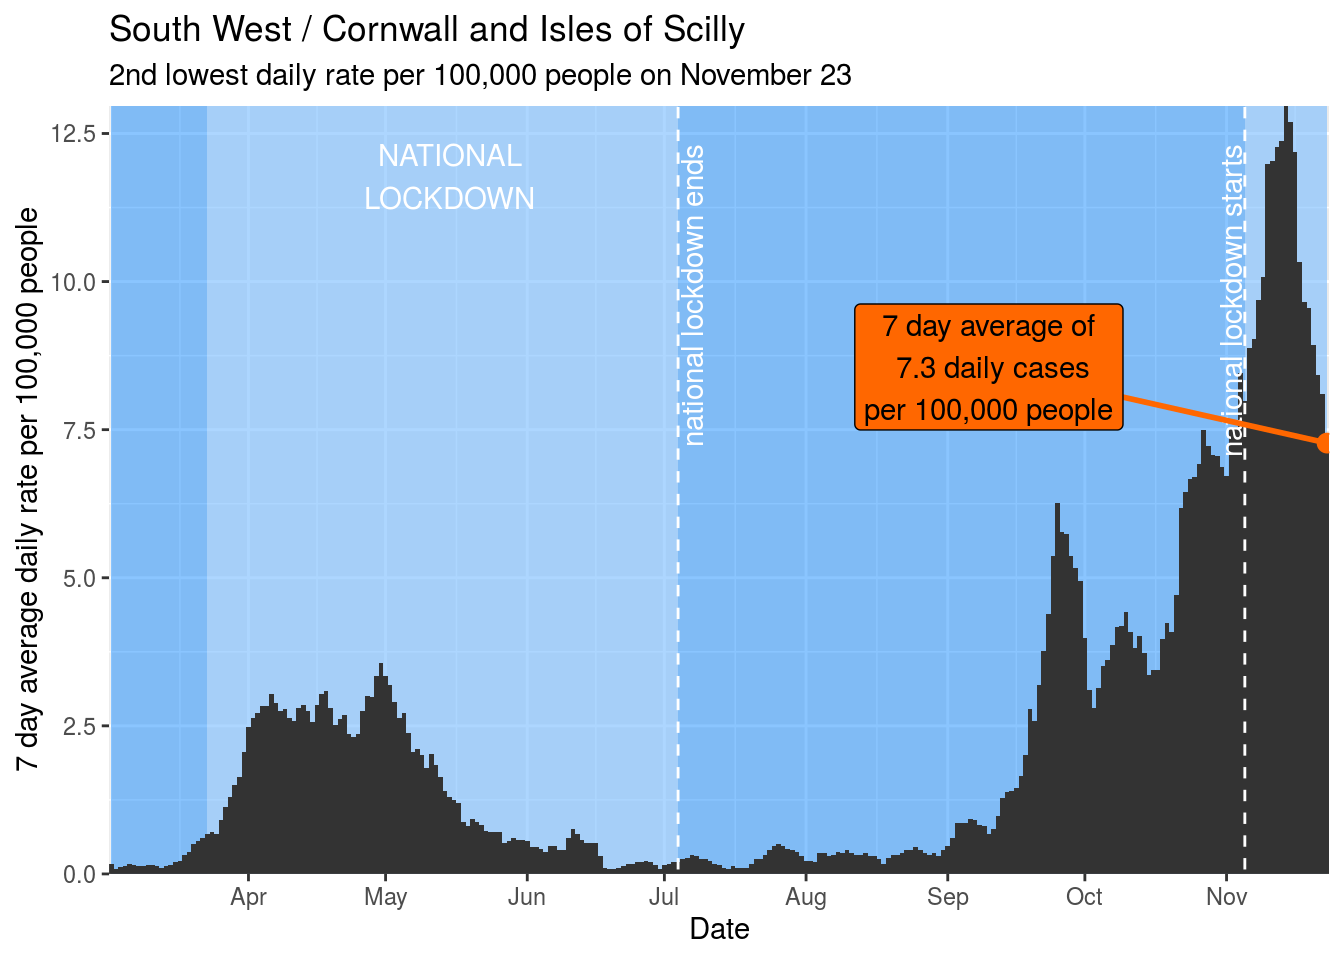
2nd : Cornwall and Isles of Scilly
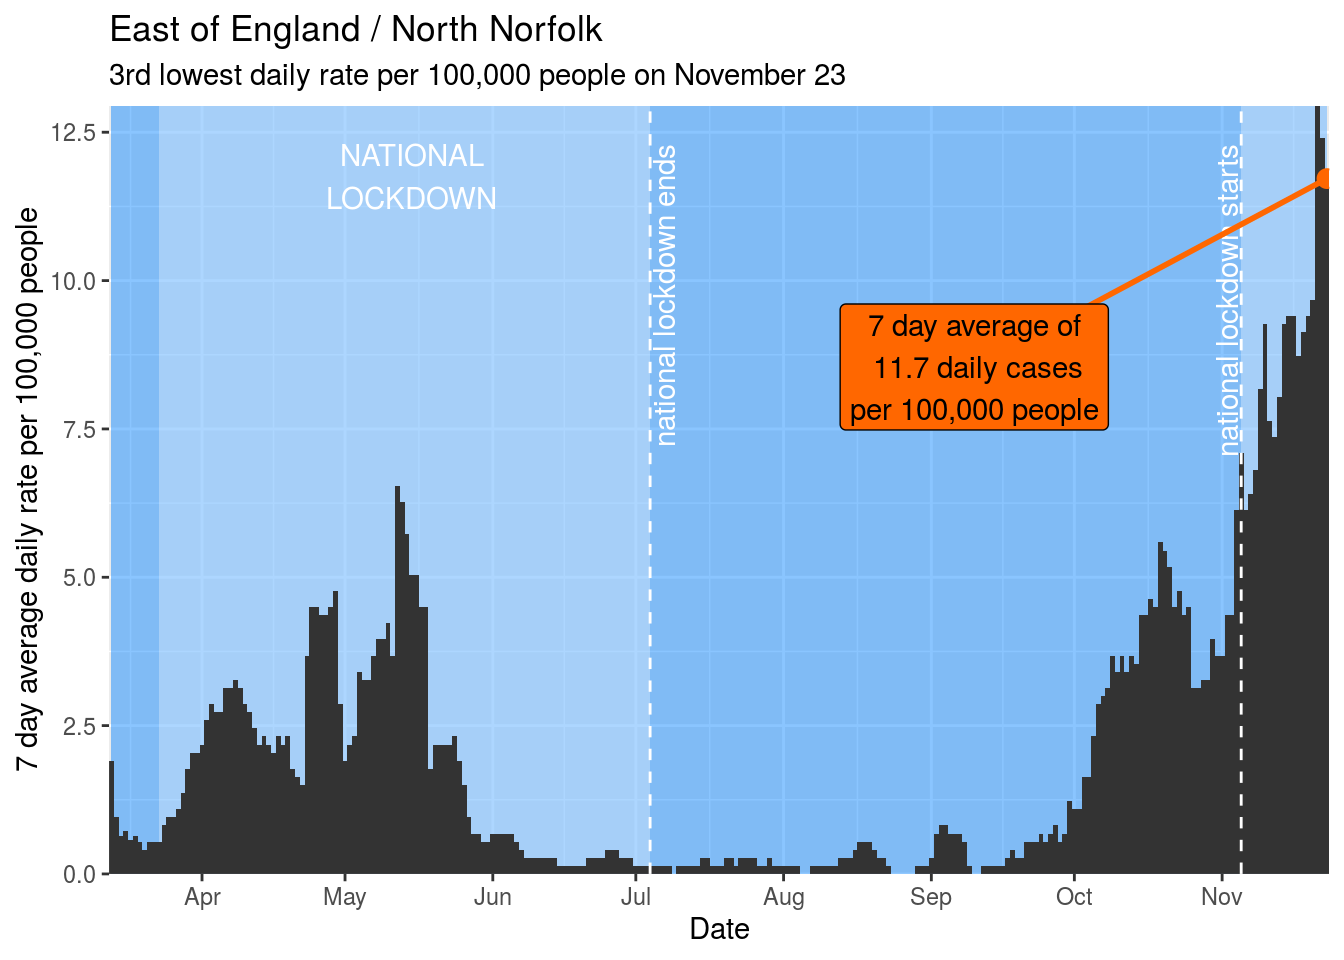
3rd : North Norfolk
Top 10
- Isle of Wight
- Cornwall and Isles of Scilly
- North Norfolk
- Allerdale
- Copeland
- Torridge
- Southwark
- Lancaster
- Plymouth
- King’s Lynn and West Norfolk
Most improved in last week
Arguably a better way of awarding local authority areas is by how much they are improving. This set of awards go to those places that have improved the most over in the week up to November 23. These are:
1st : Isle of Wight

2nd : Allerdale

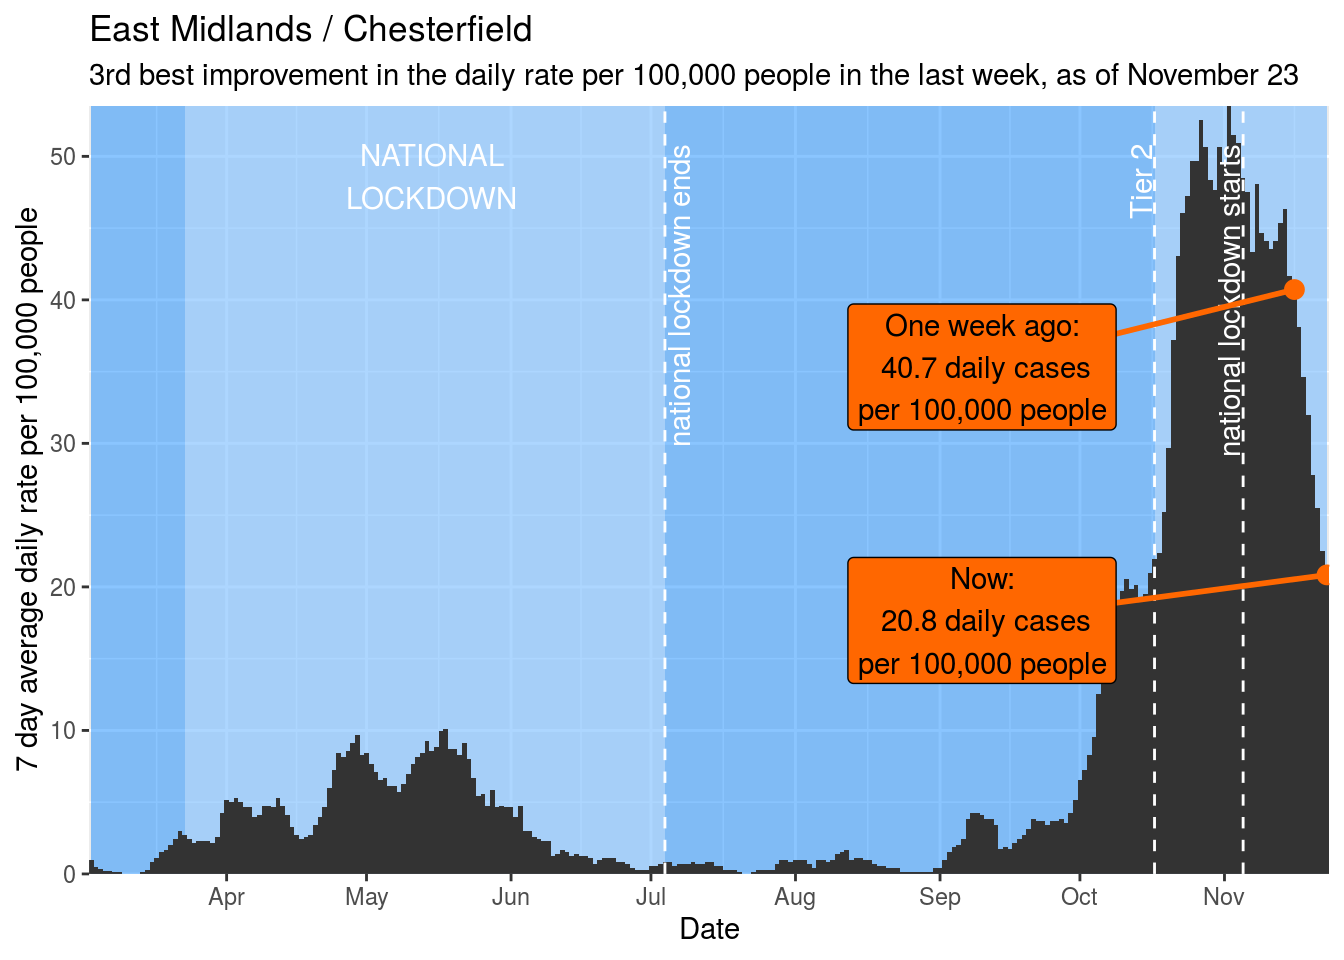
3rd : Chesterfield
Top 10
- Isle of Wight
- Allerdale
- Chesterfield
- Plymouth
- Copeland
- Bristol, City of
- Cornwall and Isles of Scilly
- Redditch
- Scarborough
- Calderdale
Most improved since 2nd wave peak
Our final set of awards go to those places that have improved the most since their 2nd wave peak. These are:
1st : Lancaster

2nd : Copeland
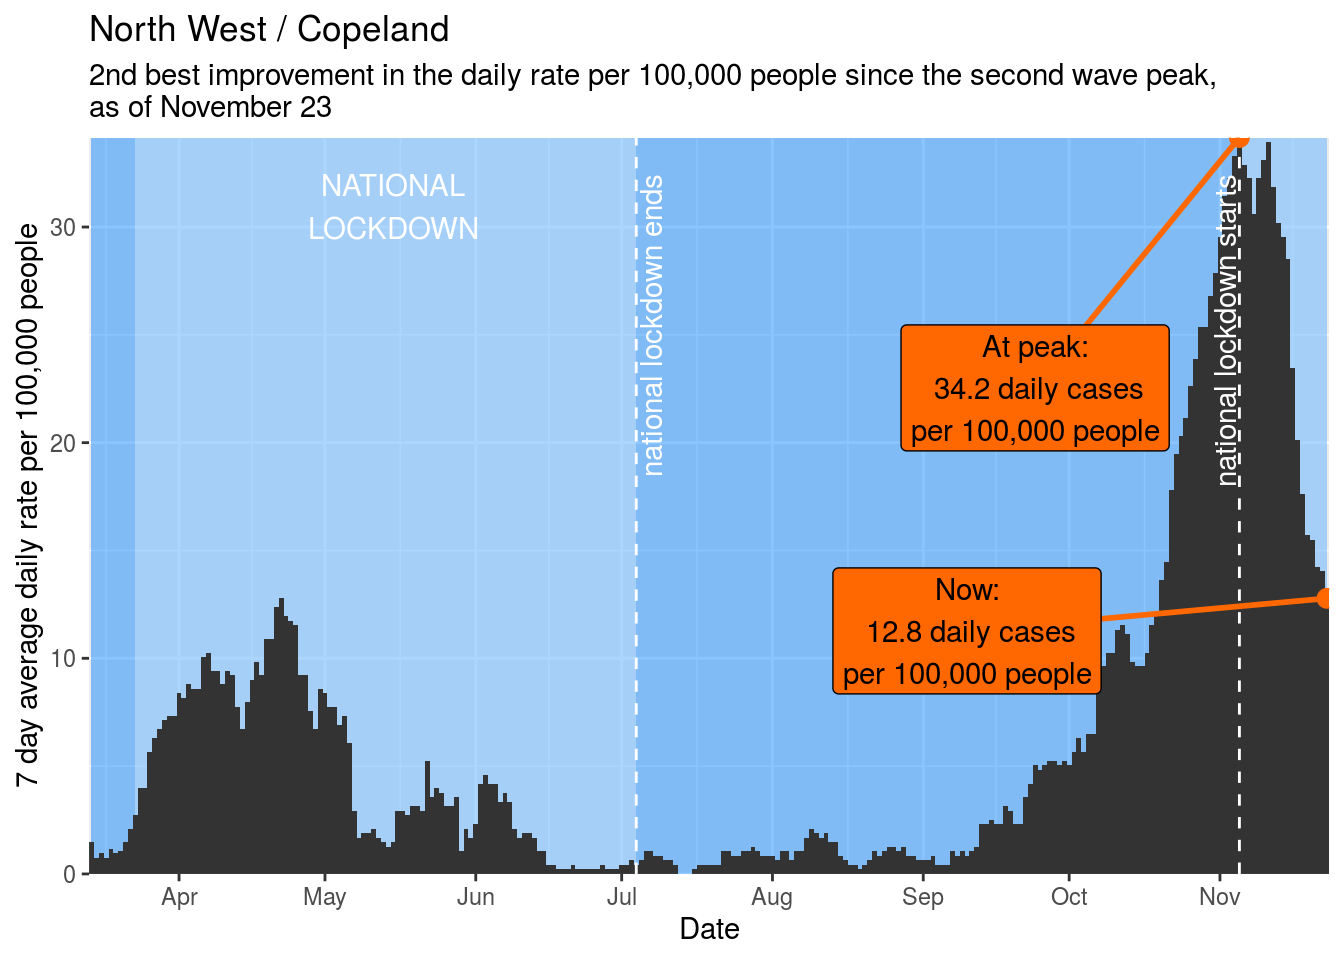
3rd : Chesterfield

Top 10
- Lancaster
- Copeland
- Chesterfield
- Wigan
- Scarborough
- Rossendale
- Allerdale
- Plymouth
- Bury
- Isle of Wight
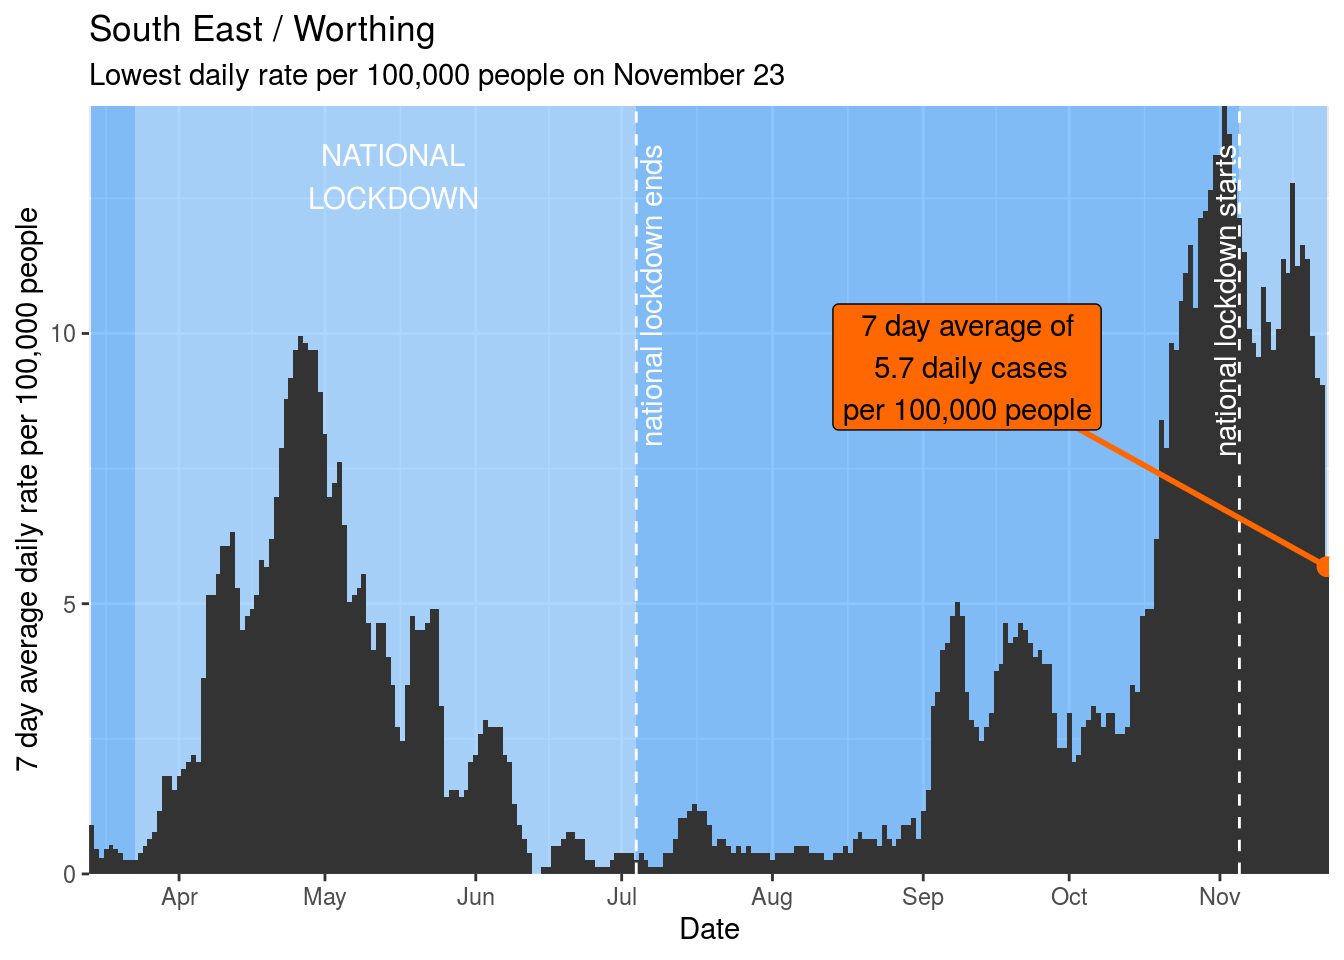
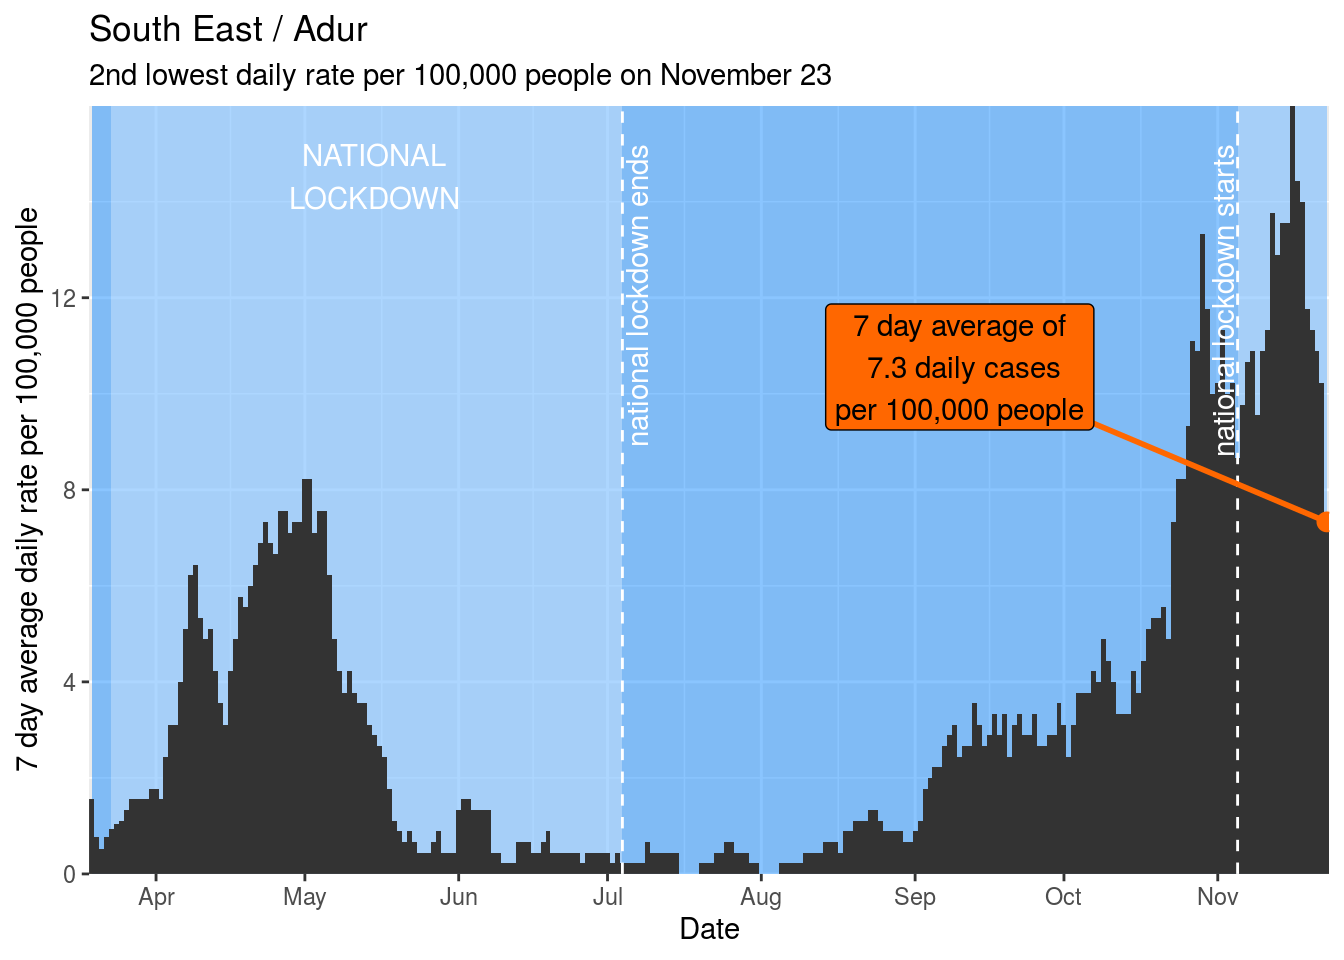
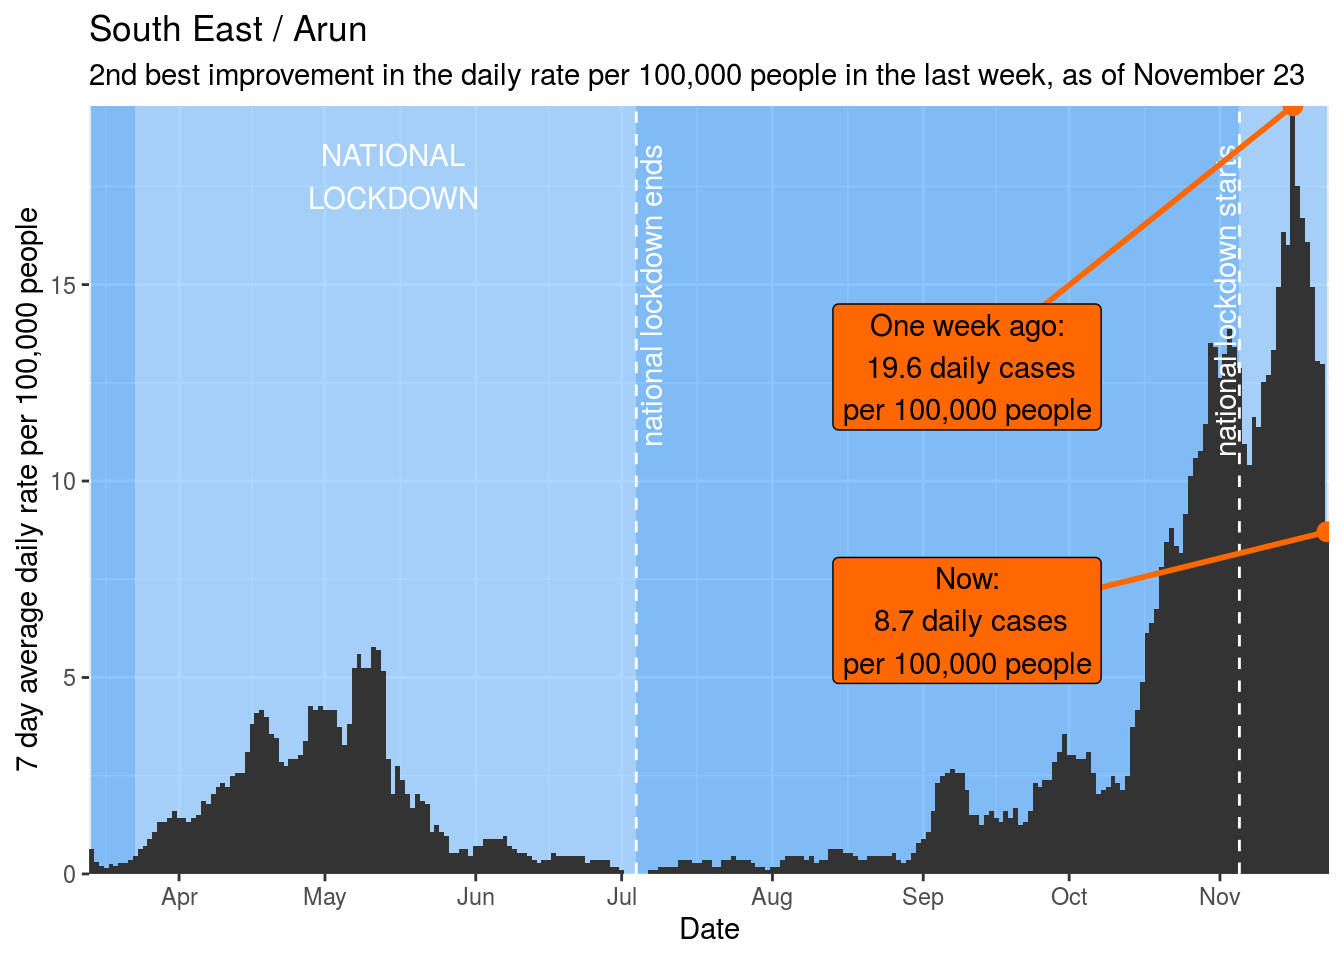
Middle quintile of deprivation
Adur | Amber Valley | Arun | Ashford | Barnet | Bedford | Bexley | Bournemouth, Christchurch and Poole | Breckland | Brighton and Hove | Broxbourne | Camden | Cannock Chase | Canterbury | Castle Point | Cheshire West and Chester | Chorley | Colchester | Crawley | Dartford | East Staffordshire | East Suffolk | Eden | Erewash | Exeter | Forest of Dean | Gosport | Havering | Herefordshire, County of | Hillingdon | Kettering | Maidstone | Mendip | Mid Devon | Milton Keynes | Newark and Sherwood | Newcastle-under-Lyme | North Devon | North East Derbyshire | North Warwickshire | Oxford | Reading | Redbridge | Rother | Shropshire | Solihull | Somerset West and Taunton | South Holland | South Somerset | Stevenage | Stockport | Swindon | Thurrock | Wandsworth | Warrington | West Devon | West Lancashire | West Lindsey | West Suffolk | Westminster | Worcester | Worthing | Wyre
Lowest daily rate
This set of awards is going to go to the areas that had the lowest average daily rates of cases per 100,000 population on November 23. These are:
1st : Worthing
2nd : Adur
3rd : West Suffolk

Top 10
- Worthing
- Adur
- West Suffolk
- Arun
- East Suffolk
- Breckland
- Brighton and Hove
- Somerset West and Taunton
- Colchester
- Mid Devon
Most improved in last week
Arguably a better way of awarding local authority areas is by how much they are improving. This set of awards go to those places that have improved the most over in the week up to November 23. These are:
1st : Worthing

2nd : Arun
3rd : Brighton and Hove
Top 10
- Worthing
- Arun
- Brighton and Hove
- Adur
- Eden
- Cheshire West and Chester
- Stevenage
- Gosport
- Erewash
- Bournemouth, Christchurch and Poole
Most improved since 2nd wave peak
Our final set of awards go to those places that have improved the most since their 2nd wave peak. These are:
1st : West Lancashire
2nd : Exeter

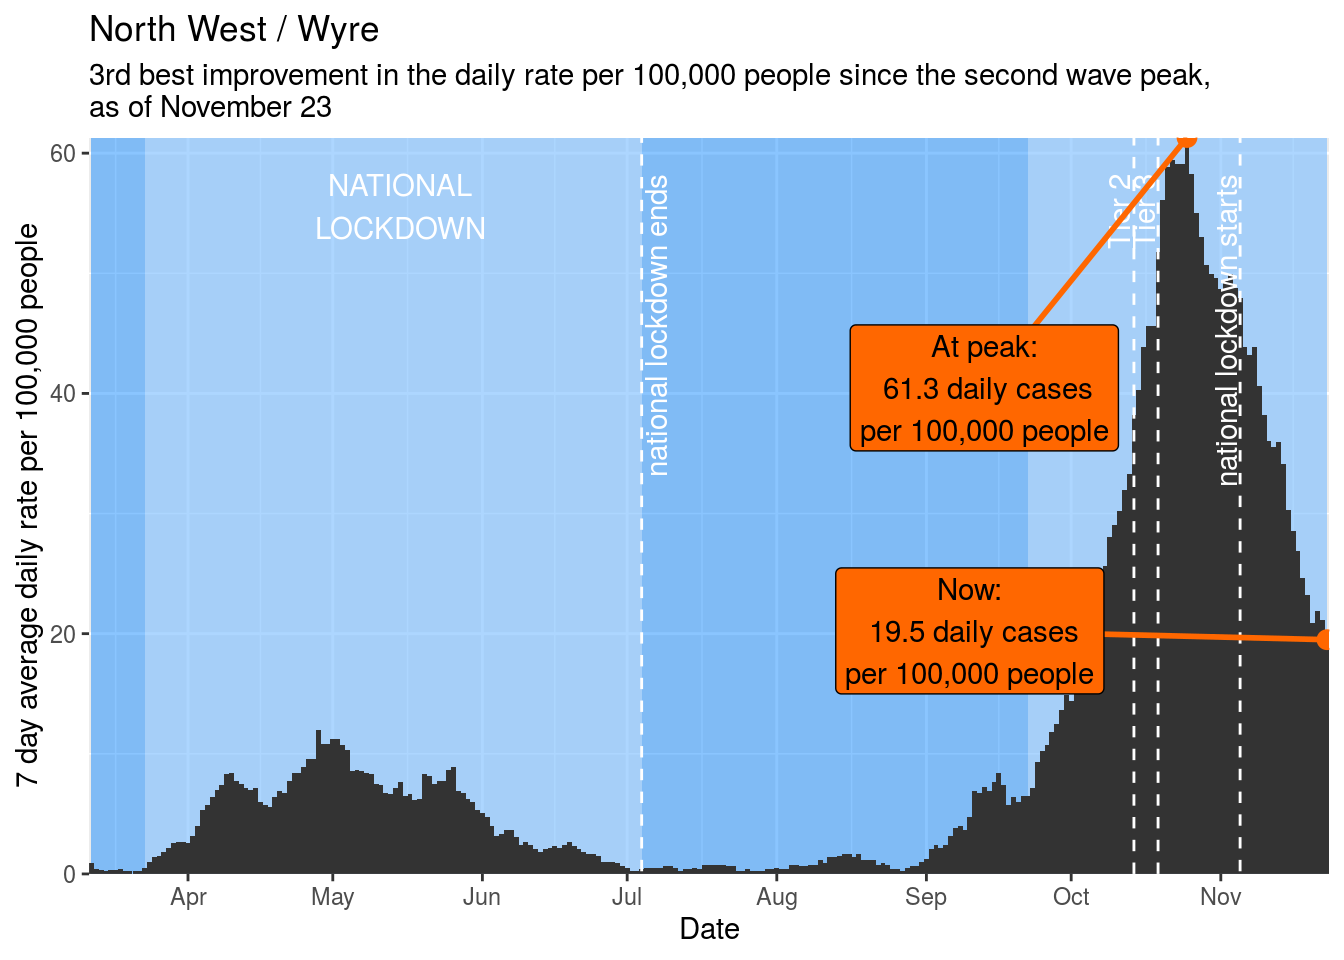
3rd : Wyre
Top 10
- West Lancashire
- Exeter
- Wyre
- Breckland
- Brighton and Hove
- Eden
- Warrington
- Worthing
- Stockport
- Arun
Second lowest quintile of deprivation
Babergh | Basingstoke and Deane | Braintree | Bromley | Broxtowe | Cambridge | Central Bedfordshire | Charnwood | Chelmsford | Cheltenham | Cherwell | Cheshire East | Chichester | Craven | Dacorum | Daventry | Dorset | East Devon | East Northamptonshire | East Riding of Yorkshire | Epping Forest | Fylde | Gedling | Harrow | Hertsmere | High Peak | Hinckley and Bosworth | Huntingdonshire | Lewes | Lichfield | Maldon | Malvern Hills | Melton | Merton | Mid Suffolk | New Forest | North Somerset | North West Leicestershire | Oadby and Wigston | Rugby | Rushmoor | Ryedale | Selby | Sevenoaks | South Derbyshire | South Hams | South Kesteven | South Lakeland | South Norfolk | South Ribble | South Staffordshire | Spelthorne | Stafford | Staffordshire Moorlands | Sutton | Teignbridge | Tonbridge and Malling | Trafford | Watford | Wealden | Welwyn Hatfield | Wiltshire | Wychavon
Lowest daily rate
This set of awards is going to go to the areas that had the lowest average daily rates of cases per 100,000 population on November 23. These are:
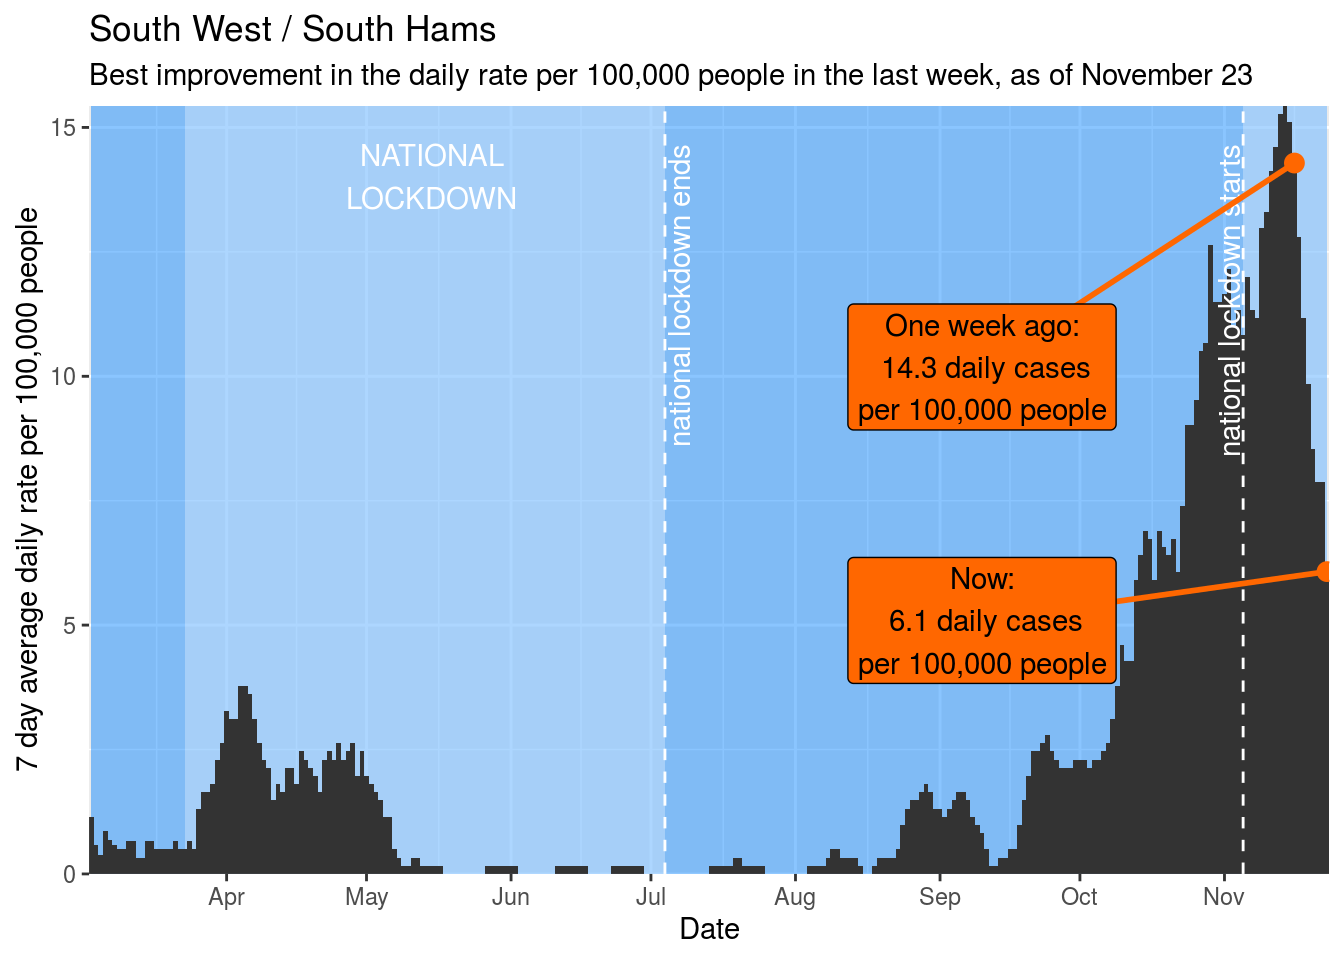
1st : South Hams

2nd : Mid Suffolk
3rd : Dorset
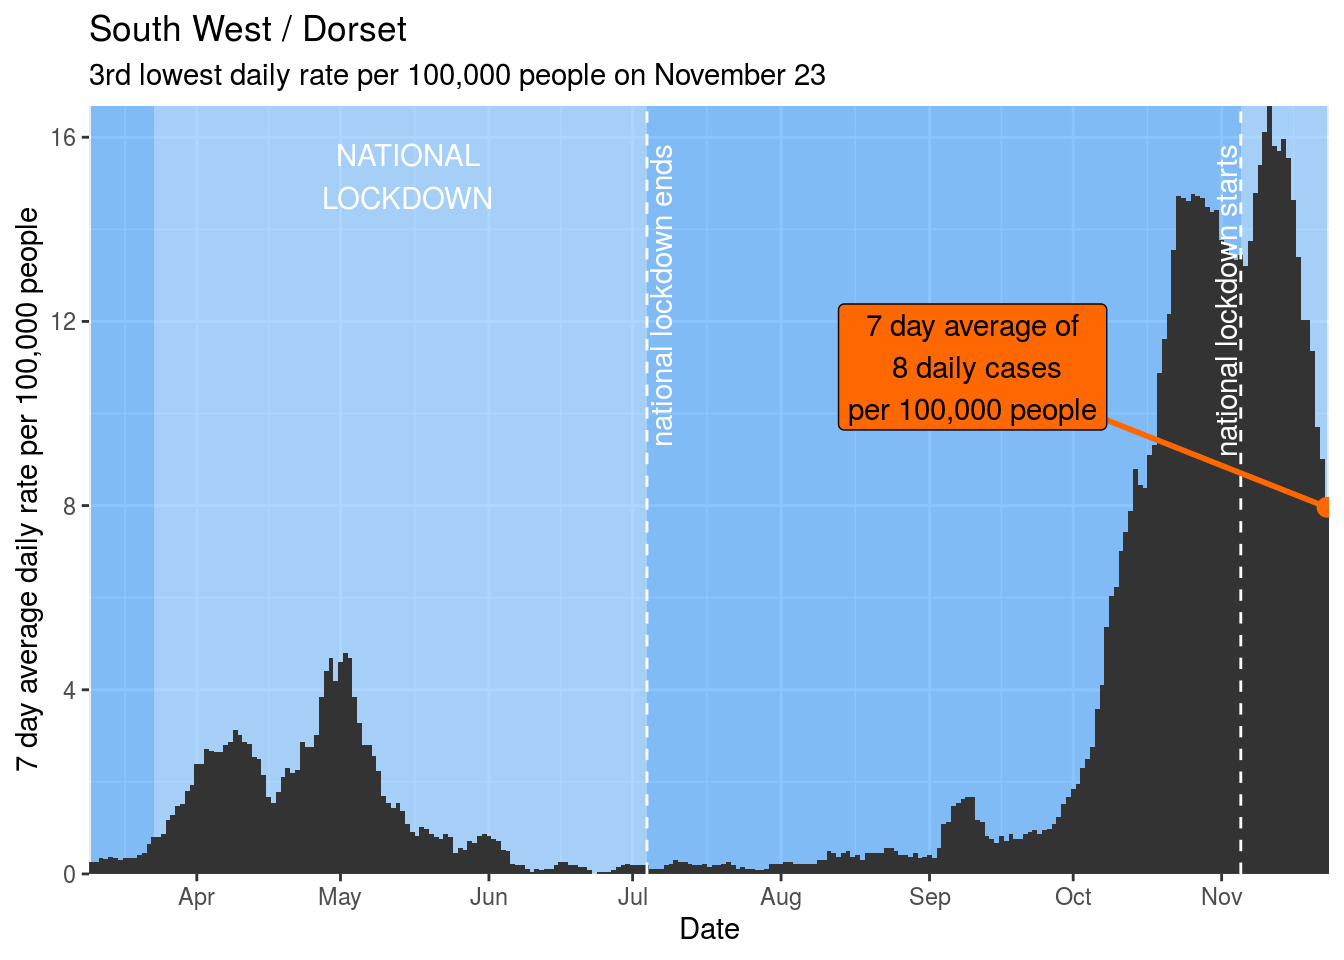
Top 10
- South Hams
- Mid Suffolk
- Dorset
- Teignbridge
- New Forest
- Huntingdonshire
- Maldon
- Central Bedfordshire
- Lewes
- Basingstoke and Deane
Most improved in last week
Arguably a better way of awarding local authority areas is by how much they are improving. This set of awards go to those places that have improved the most over in the week up to November 23. These are:
1st : South Hams
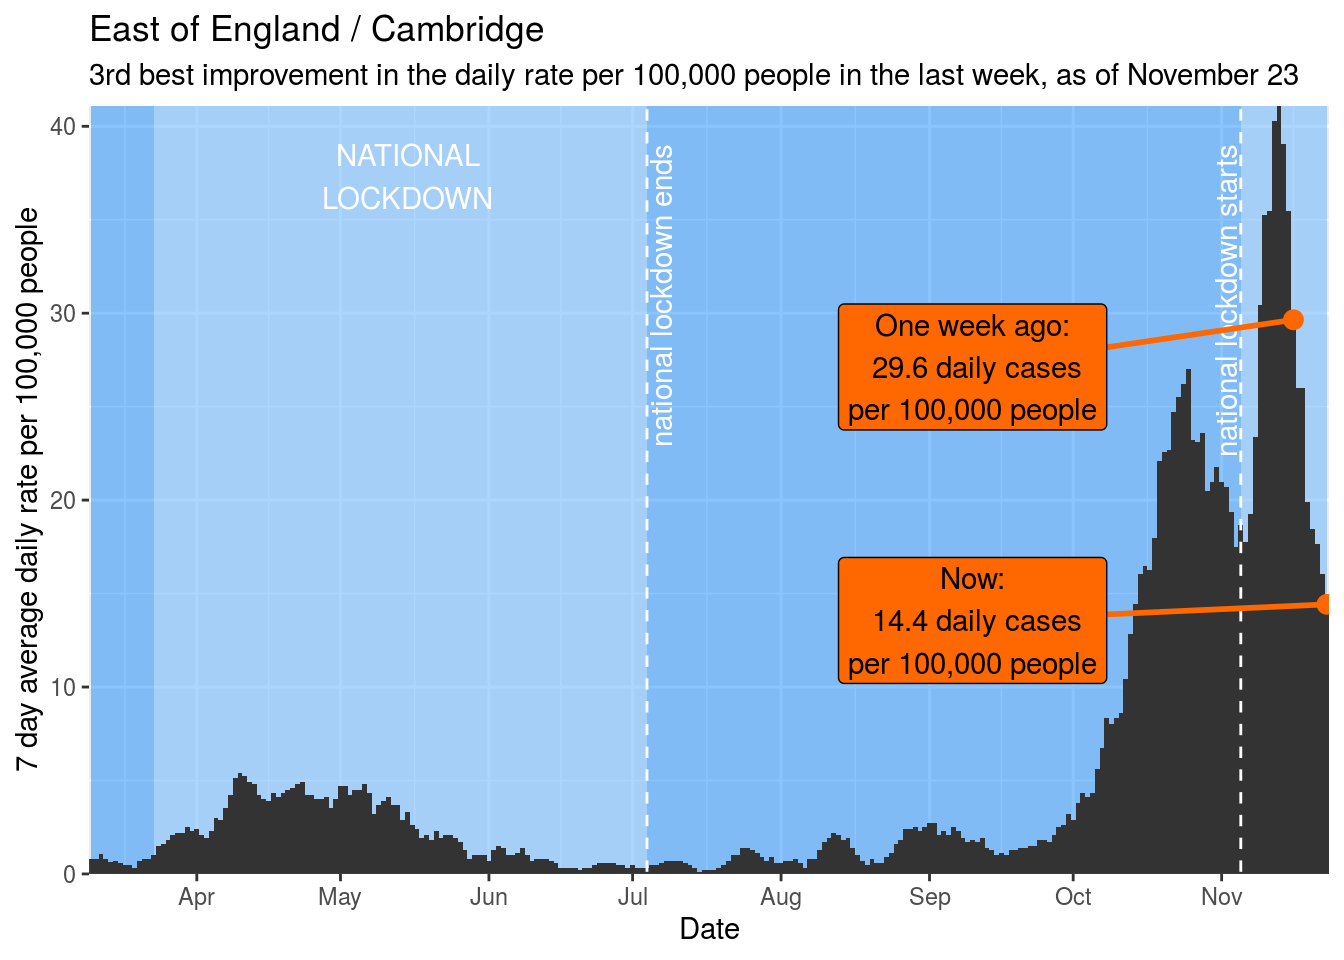
2nd : New Forest

3rd : Cambridge
Top 10
- South Hams
- New Forest
- Cambridge
- Hinckley and Bosworth
- Trafford
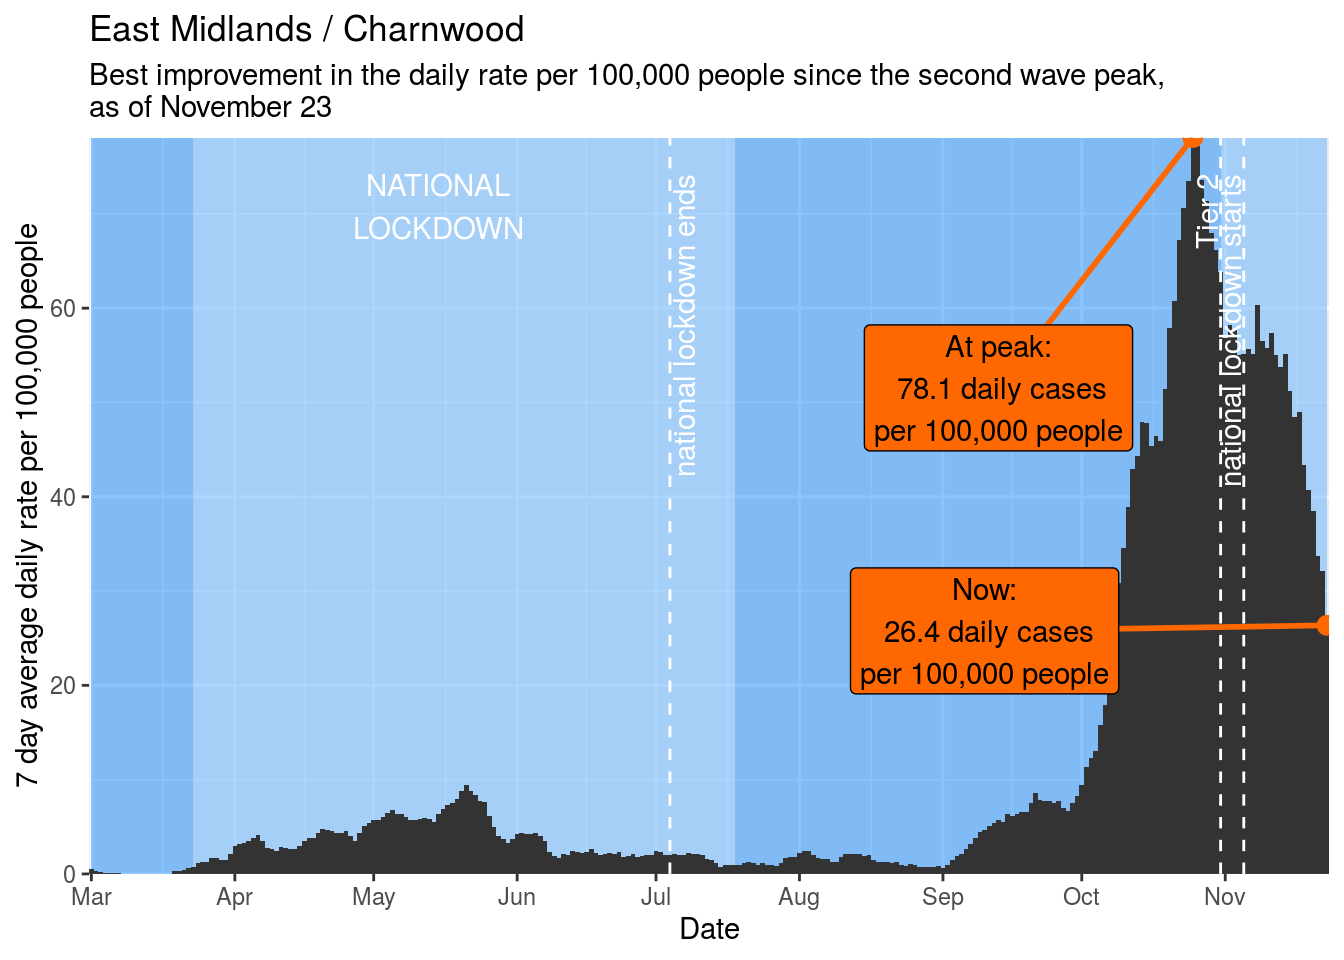
- Charnwood
- Dorset
- Daventry
- Staffordshire Moorlands
- Basingstoke and Deane
Most improved since 2nd wave peak
Our final set of awards go to those places that have improved the most since their 2nd wave peak. These are:
1st : Charnwood
2nd : Cambridge
3rd : Trafford
Top 10
- Charnwood
- Cambridge
- Trafford
- Broxtowe
- New Forest
- Gedling
- South Hams
- Daventry
- High Peak
- East Northamptonshire
Lowest quintile of deprivation (least deprived)
Aylesbury Vale | Bath and North East Somerset | Blaby | Bracknell Forest | Brentwood | Broadland | Bromsgrove | Chiltern | Cotswold | Derbyshire Dales | East Cambridgeshire | East Hampshire | East Hertfordshire | Eastleigh | Elmbridge | Epsom and Ewell | Fareham | Guildford | Hambleton | Harborough | Harrogate | Hart | Horsham | Kingston upon Thames | Mid Sussex | Mole Valley | North Hertfordshire | North Kesteven | Reigate and Banstead | Ribble Valley | Richmond upon Thames | Richmondshire | Rochford | Runnymede | Rushcliffe | Rutland | South Bucks | South Cambridgeshire | South Gloucestershire | South Northamptonshire | South Oxfordshire | St Albans | Stratford-on-Avon | Stroud | Surrey Heath | Tandridge | Test Valley | Tewkesbury | Three Rivers | Tunbridge Wells | Uttlesford | Vale of White Horse | Warwick | Waverley | West Berkshire | West Oxfordshire | Winchester | Windsor and Maidenhead | Woking | Wokingham | Wycombe | York
Lowest daily rate
This set of awards is going to go to the areas that had the lowest average daily rates of cases per 100,000 population on November 23. These are:
1st : Cotswold
2nd : South Cambridgeshire
3rd : West Oxfordshire

Top 10
- Cotswold
- South Cambridgeshire
- West Oxfordshire
- Hart
- South Oxfordshire
- Bracknell Forest
- Vale of White Horse
- West Berkshire
- Eastleigh
- Rutland
Most improved in last week
Arguably a better way of awarding local authority areas is by how much they are improving. This set of awards go to those places that have improved the most over in the week up to November 23. These are:
1st : Cotswold

2nd : Bath and North East Somerset
3rd : Winchester

Top 10
- Cotswold
- Bath and North East Somerset
- Winchester
- South Oxfordshire
- Bracknell Forest
- South Cambridgeshire
- Harrogate
- Rutland
- South Gloucestershire
- Vale of White Horse
Most improved since 2nd wave peak
Our final set of awards go to those places that have improved the most since their 2nd wave peak. These are:
1st : York

2nd : Cotswold
3rd : Ribble Valley

Top 10
- York
- Cotswold
- Ribble Valley
- Rushcliffe
- Bath and North East Somerset
- Mole Valley
- Harrogate
- West Oxfordshire
- Eastleigh
- South Oxfordshire